Department of Orthopedic Surgery, Korea University Ansan Hospital, Korea University College of Medicine, Ansan, Korea
Corresponding author: Jiwon Park, M.D., Ph.D. Department of Orthopaedic Surgery, Korea University Ansan Hospital, Korea University College of Medicine, 123 Jeokgeum-ro, Danwon-gu, Ansan 15355, Korea TEL: +82-31-412-4862, FAX: +82-31-487-9502, E-mail: jwpark506@gmail.com
• Received: May 8, 2026 • Revised: June 9, 2026 • Accepted: June 15, 2026
This is an open access article distributed under the terms of the Creative Commons Attribution Non-Commercial License (https://creativecommons.org/licenses/by-nc/4.0/) which permits unrestricted non-commercial use, distribution, and reproduction in any medium, provided the original work is properly cited.
This study aimed to evaluate the predictive performance of preoperative computed tomography–based Hounsfield unit (HU) and magnetic resonance imaging-based vertebral bone quality score (VBQS) for cage subsidence after 1- to 2-level oblique lumbar interbody fusion (OLIF), and whether it differs by intraoperative cage placement position.
Methods
Ninety-one OLIF levels in 54 patients (2015–2022) were retrospectively reviewed in this single-center cohort. Subsidence was defined as ≥2 mm middle disc-height reduction or ≥2 mm cage protrusion at 1 year. Multivariable logistic regression with cluster-robust standard errors estimated adjusted odds ratios (OR); the pre-specified primary test was the lower-instrumented-vertebra HU×cage-position interaction.
Results
Subsidence occurred in 24 of 91 levels (26.4%). Each one-standard-deviation decrease in lower-instrumented-vertebra HU was independently associated with subsidence (adjusted OR, 0.40; 95% confidence interval, 0.20 to 0.81; p=0.011); VBQS was not. The subsidence group included more osteoporosis-range levels (<110 HU; 62.5% vs. 25.4%, p=0.003). The interaction was not significant (p=0.553), but the HU effect concentrated in middle-placed cages (adjusted OR, 0.345; p=0.012) and attenuated in anterior-placed cages (OR, 0.50; p=0.185).
Conclusion
Lower-instrumented-vertebra HU is an independent predictor of cage subsidence after 1- to 2-level OLIF, most evident in middle-placed cages.
Oblique lumbar interbody fusion (OLIF) is an effective surgical option for lumbar degenerative disease, providing indirect neural decompression through restoration of disc height while sparing the posterior elements.1,2) A wide intervertebral cage is essential to this mechanism, restoring disc height, correcting sagittal and coronal balance, and supporting interbody fusion.3) However, cage subsidence remains one of the most common cage-related complications and may compromise the effect of indirect decompression by recreating foraminal stenosis, and predispose to pseudoarthrosis or instrumentation failure.4,5)
Among the recognised contributors to cage subsidence, poor preoperative bone quality is widely regarded as a major risk factor.5,6) While Dual-energy X-ray absorptiometry remains the standard for bone-density assessment, it is influenced by lumbar degenerative change and is not always available preoperatively.7,8) Therefore, recently two readily available imaging surrogates have been advocated: the computed tomography (CT)–based Hounsfield unit (HU) value, which correlates with vertebral bone mineral density and trabecular strength;9,10) and the magnetic resonance imaging (MRI)–based vertebral bone quality score (VBQS), which captures bone-marrow fatty infiltration as a surrogate of trabecular degeneration.11)
Several OLIF series have linked low HU values and high VBQS to cage subsidence.6,12-17) However, existing studies have treated bone quality as a uniform predictor irrespective of intraoperative cage placement. The cage may rest in the anterior one-third of the inferior endplate, where it engages the dense apophyseal ring, or in the middle one-third, where it bears on weaker central trabecular bone. Whether this placement difference modifies the predictive value of preoperative HU or VBQS for cage subsidence has not been formally tested. Our group recently reported HU, VBQS, and posterior disc-height distraction as independent predictors of subsidence in a 119-level OLIF cohort.18) In our previous study, we did not stratify by cage position or by upper-versus-lower-instrumented-vertebra HU. Therefore, the present study aimed to evaluate whether the predictive performance of preoperative CT-based HU values and MRI-based VBQS for cage subsidence differs by cage placement position, with upper- and lower-instrumented-vertebra HU values analysed separately.
Methods
1. Study design and population
This was a retrospective single-centre cohort study performed at a tertiary academic medical centre in the Republic of Korea. The Institutional Review Board approved the protocol and waived informed consent because of the retrospective design. Reporting follows the STROBE Statement for observational cohort studies.19)
Consecutive patients who underwent 1- to 2-level OLIF by a single orthopaedic spine surgeon between January 2015 and August 2022 were eligible. Inclusion required preoperative diagnosis of degenerative lumbar disease, complete preoperative CT and MRI, and follow-up lateral radiographs and lumbar CT at 1 year postoperatively. Patients were excluded if they had previous lumbar fusion, surgery extending to the sacral or thoracic levels, diffuse idiopathic skeletal hyperostosis, ankylosing spondylitis, prior infectious spondylitis, lumbar tumour, or lumbar compression fracture.
This cohort represents a 1- to 2-level subset of the larger 119-level cohort previously reported by the present authors.18) The current analysis addresses a different research question (effect modification by cage placement position) using a different outcome operationalisation, predictor stratification (separate upper and lower instrumented vertebrae), and multivariable framework (cluster-robust standard errors), as detailed below.
2. Radiological measurements
1) HU value
Preoperative axial CT images (Ingenuity, Philips Healthcare, Eindhoven, Netherlands; slice thickness 1–3 mm) were reviewed. For each surgical level, the HU value was measured at three axial slices in each instrumented vertebra (just below the upper endplate, in the middle, and just above the lower endplate). The maximum elliptical region of interest was placed centrally in trabecular bone, excluding cortical margins and central vein; the mean of three slices was recorded as the vertebral HU value. In contrast to the level-averaged HU used in our larger cohort study, the present analysis kept the upper- and lower-instrumented-vertebra HU values as separate predictors.18) Because dual-energy X-ray absorptiometry and bone-active medication histories (bisphosphonates, denosumab, teriparatide) were not available in this retrospective cohort, vertebral HU was additionally used as an opportunistic surrogate of bone status: each instrumented vertebra was categorised by published thresholds as osteoporosis-range (<110 HU), low-bone-mass range (110–159 HU), or normal-range (≥160 HU).9)
2) Vertebral bone quality score
The VBQS was calculated on preoperative non-contrast T1-weighted sagittal MRI (MAGNETOM Vida, Siemens Healthineers, Erlangen, Germany) following Ehresman et al.11) Circular regions of interest were placed in the medullary portion of each vertebral body from L1 to L5 and within the cerebrospinal fluid (CSF) at the L3 level (or the closest unobstructed adjacent level if L3 CSF was unavailable). Two formulations were computed: Global VBQS=mean signal intensity of L1–L5/mean signal intensity of CSF at L3; and Segmental VBQS=mean signal intensity of the upper and lower instrumented vertebrae/mean signal intensity of CSF at L3. The L1–L5 mean formulation matches the original Ehresman protocol.
3) Cage placement position
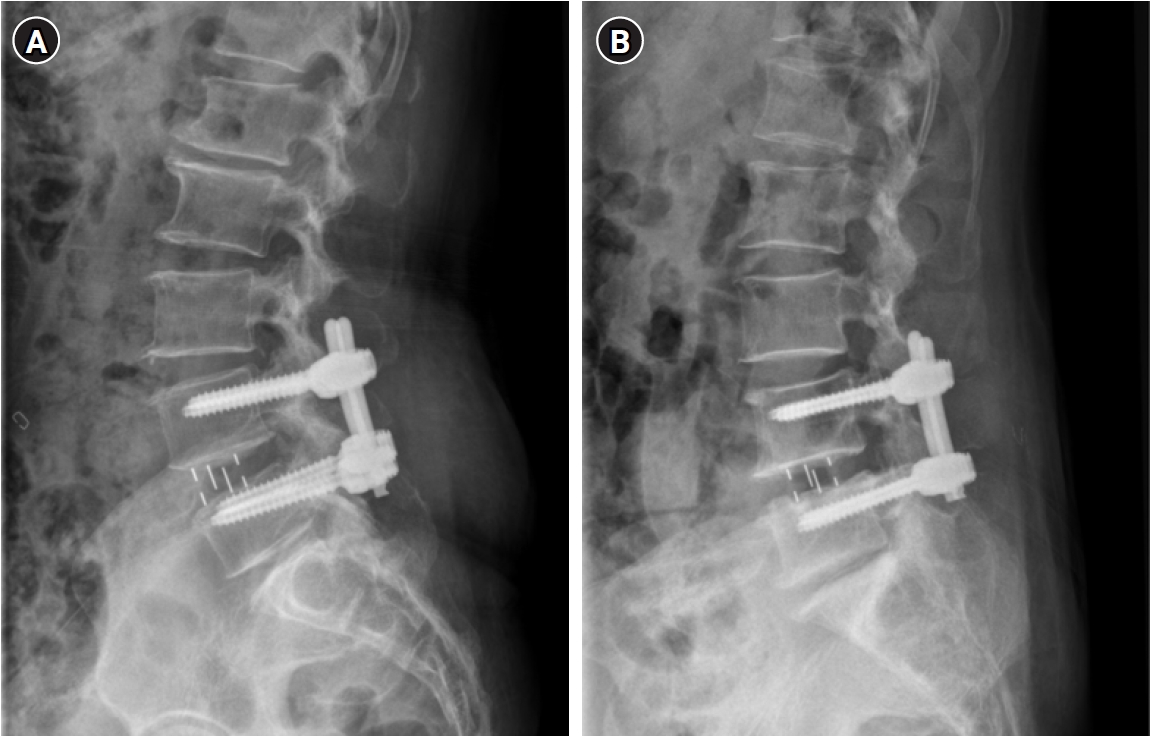
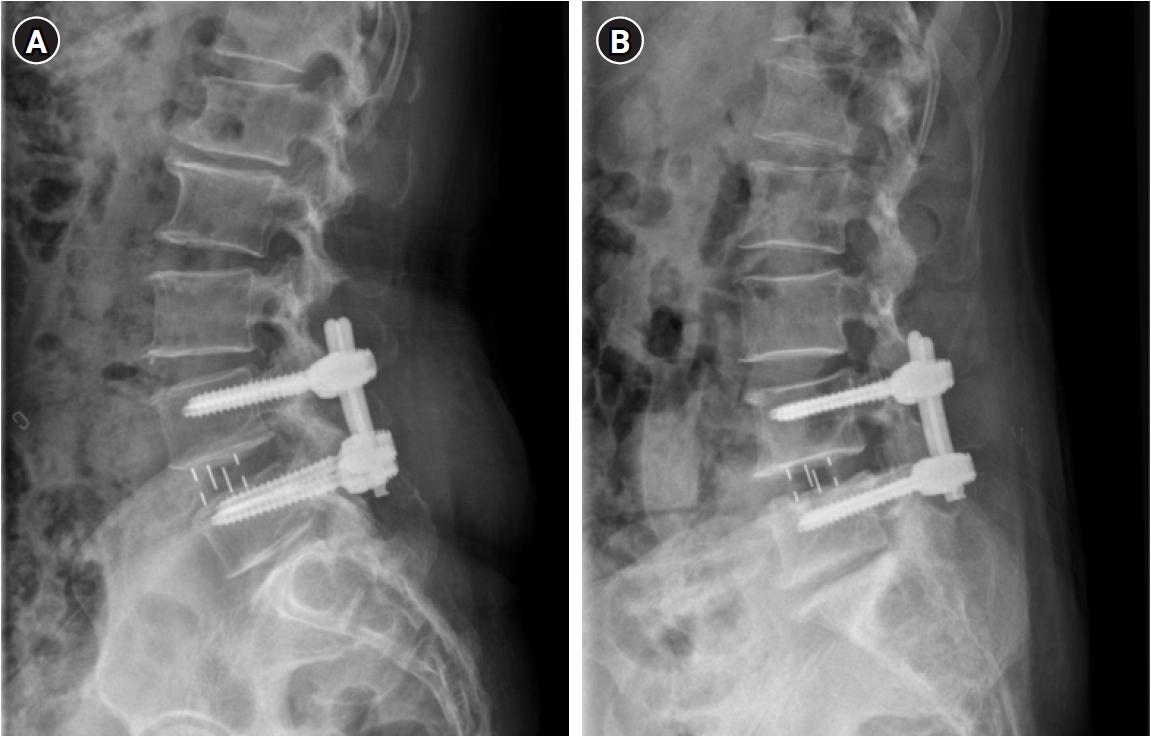
On the immediate-postoperative lateral radiograph, the anteroposterior length of the inferior endplate of the upper instrumented vertebra was divided into three equal zones (anterior, middle, and posterior thirds) (Fig. 1). The mid-sagittal geometric centre of the cage—the midpoint between its anterior and posterior radio-opaque margins on the same projection—was identified, and cage placement was classified according to the zone in which this geometric centre lay.17) No cage centre fell within the posterior third, so placements were categorised as anterior- or middle-third.
4) Cage subsidence
Cage subsidence was defined as either (1) ≥ 2 mm reduction in middle intervertebral height on lateral radiographs from the immediate postoperative to the 1-year follow-up period, or (2) ≥ 2 mm cage protrusion through the upper or lower endplate on the 1-year postoperative CT scan. This composite definition captures vertical settling and endplate violation and is broader than the posterior-disc-height-based definition used by Koo et al.18); the implication of this difference was examined in a sensitivity analysis.
3. Statistical analysis
Continuous variables were reported as mean±standard deviation and compared by t-test or the Mann-Whitney U test according to normality (Shapiro-Wilk); categorical variables, including the HU-based bone-status categories, were compared by the chi-square or Fisher’s exact test.
For each candidate predictor (upper-instrumented-vertebra HU, lower-instrumented-vertebra HU, global VBQS, segmental VBQS), the area under the receiver-operating-characteristic curve (AUC) with 95% confidence interval (CI) (DeLong’s method)20) and the Youden-optimal threshold with corresponding sensitivity, specificity, positive predictive value, and negative predictive value were derived in the whole cohort and within each cage-position subgroup; pairwise AUC differences were tested with DeLong's correlated or uncorrelated test as appropriate.
Because some patients contributed two surgical levels, multivariable logistic regression was performed with cluster-robust (sandwich) standard errors on the patient identifier. Continuous predictors were standardized to z-scores; odds ratios (OR) represent the change in odds per one standard-deviation decrease in HU or increase in VBQS. The pre-specified primary model adjusted for age, L5–S1 level, and cage position, and tested a lower-instrumented-vertebra HU×cage-position interaction (the single primary inferential test); secondary models substituted upper-instrumented-vertebra HU, global VBQS, or segmental VBQS as the bone-quality predictor. Position-stratified ORs were derived from the interaction terms, and reduced models without the interaction term estimated adjusted main effects.
Three pre-specified sensitivity analyses (1) refitted the models with naive (model-based) standard errors, (2) excluded the single L1–L2 and the five L5–S1 cases, and (3) repeated the analysis using a posterior-disc-height-only outcome.18) A two-sided p<0.05 was considered statistically significant. All statistical analyses were performed using Python 3.11 (Python Software Foundation, Wilmington, DE, USA).
4. Ethics statement
This study was approved by the Institutional Review Board (IRB No. 2023AS0282); the requirement for informed consent was waived because of the retrospective design.
Results
1. Cohort and baseline characteristics
A total of 91 surgical levels in 54 patients met the eligibility criteria. Cage subsidence at 1-year follow-up occurred in 24 of 91 levels (26.4%). Compared with the non-subsidence group, the subsidence group was significantly older (73.0±9.9 vs. 67.5±7.8 years, p=0.001) and had lower upper- and lower-instrumented-vertebra HU values, while the two groups did not differ in operative-level distribution, cage position, cage obliquity, or VBQS (Table 1). The cage was placed in the anterior one-third in 41 levels (45.1%) and in the middle one-third in 50 levels (54.9%); subsidence rates by position were 19.5% (8/41) for anterior and 32.0% (16/50) for middle placement.
2. Opportunistic bone-status categorisation
Applying the opportunistic HU thresholds to the lower instrumented vertebra, 32 of 91 levels (35.2%) were osteoporosis-range (<110 HU). Osteoporosis-range levels were more frequent in the subsidence group than the non-subsidence group (62.5%, 15/24 vs. 25.4%, 17/67; p=0.003), and 87.5% (21/24) of subsided levels fell below 160 HU versus 52.2% (35/67) of non-subsided levels (p=0.003); the three-category distribution differed by subsidence status (p=0.002) (Table 1).
3. Position-stratified group comparison
Within the middle-placement subgroup, the lower-instrumented-vertebra HU was substantially lower in the subsidence group (mean difference −59.1 HU, p=0.002), and the upper-instrumented-vertebra HU also differed significantly (mean difference −39.2 HU, p=0.017). In the anterior-placement subgroup, the corresponding HU differences were smaller and not significant (lower-vertebra mean difference −34.7 HU, p=0.197; upper-vertebra mean difference −35.0 HU, p=0.155). Neither global nor segmental VBQS differed significantly between groups in either subgroup (Table 1).
4. Receiver-operating-characteristic analysis
Whole-cohort AUC values (95% CIs) were 0.685 (0.556 to 0.814) for upper-instrumented-vertebra HU, 0.723 (0.602 to 0.843) for lower-instrumented-vertebra HU, 0.571 (0.429 to 0.712) for global VBQS, and 0.576 (0.441 to 0.712) for segmental VBQS (Table 2). In the whole cohort, paired DeLong's tests showed no significant difference between any pair of predictors (all p≥0.10).
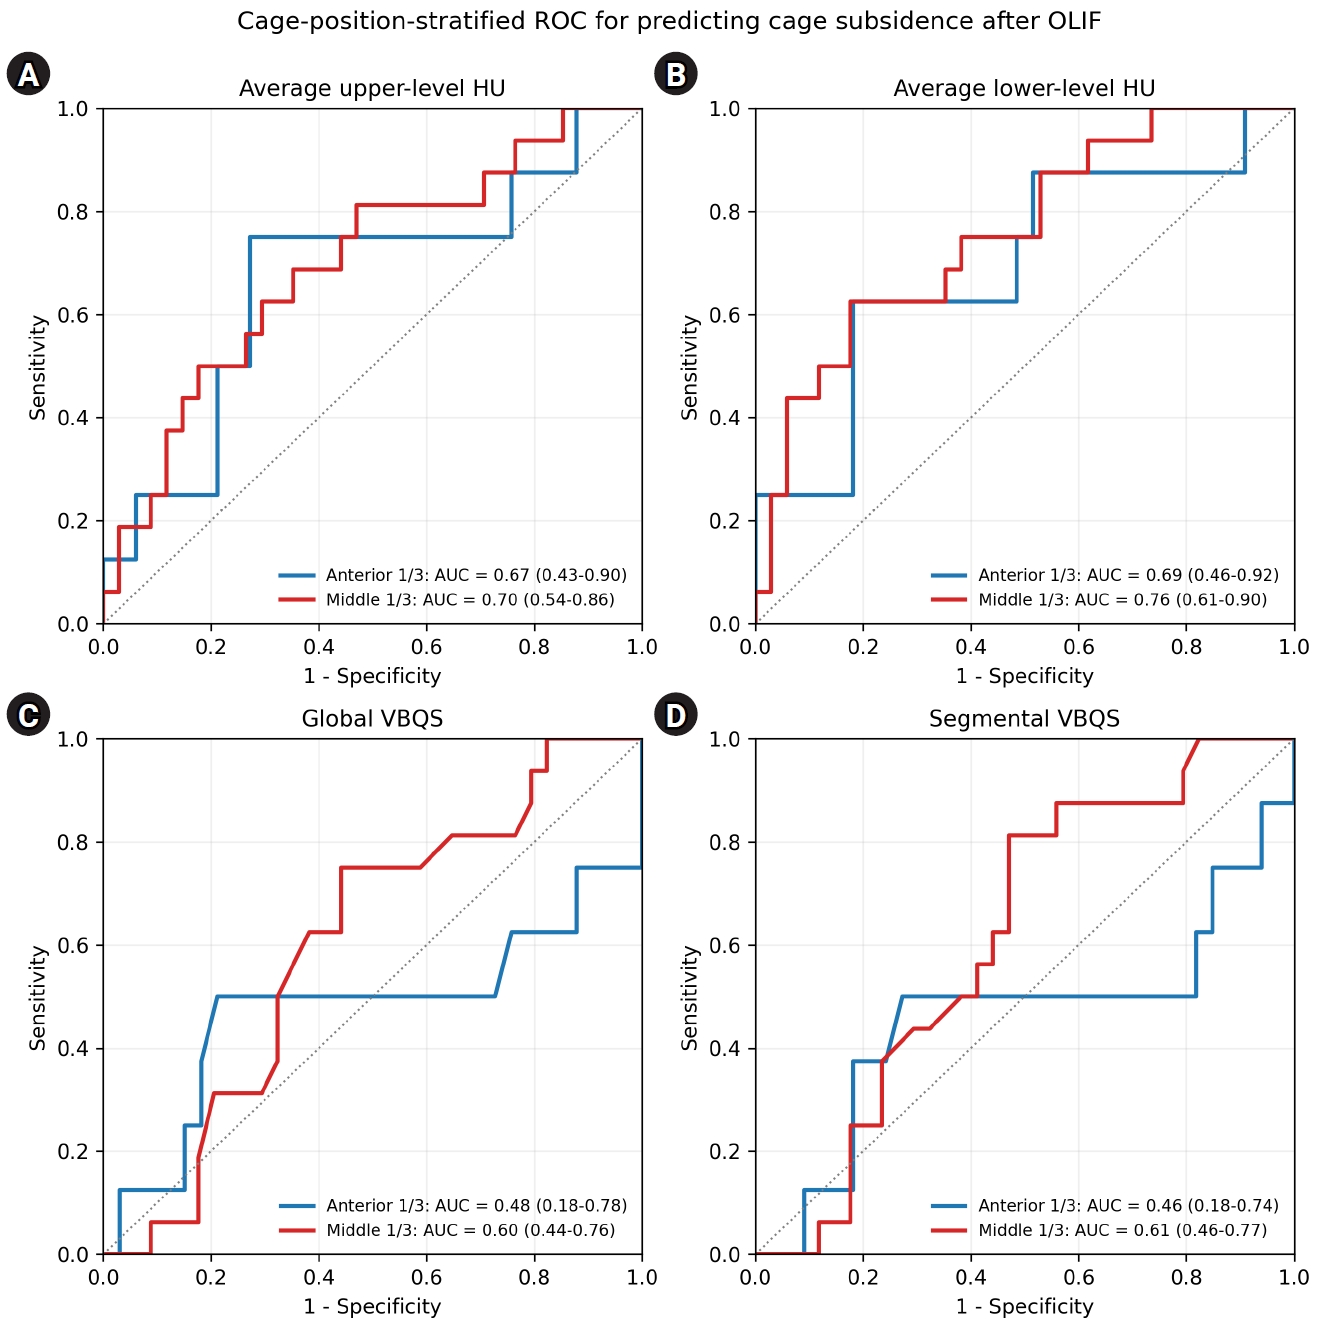
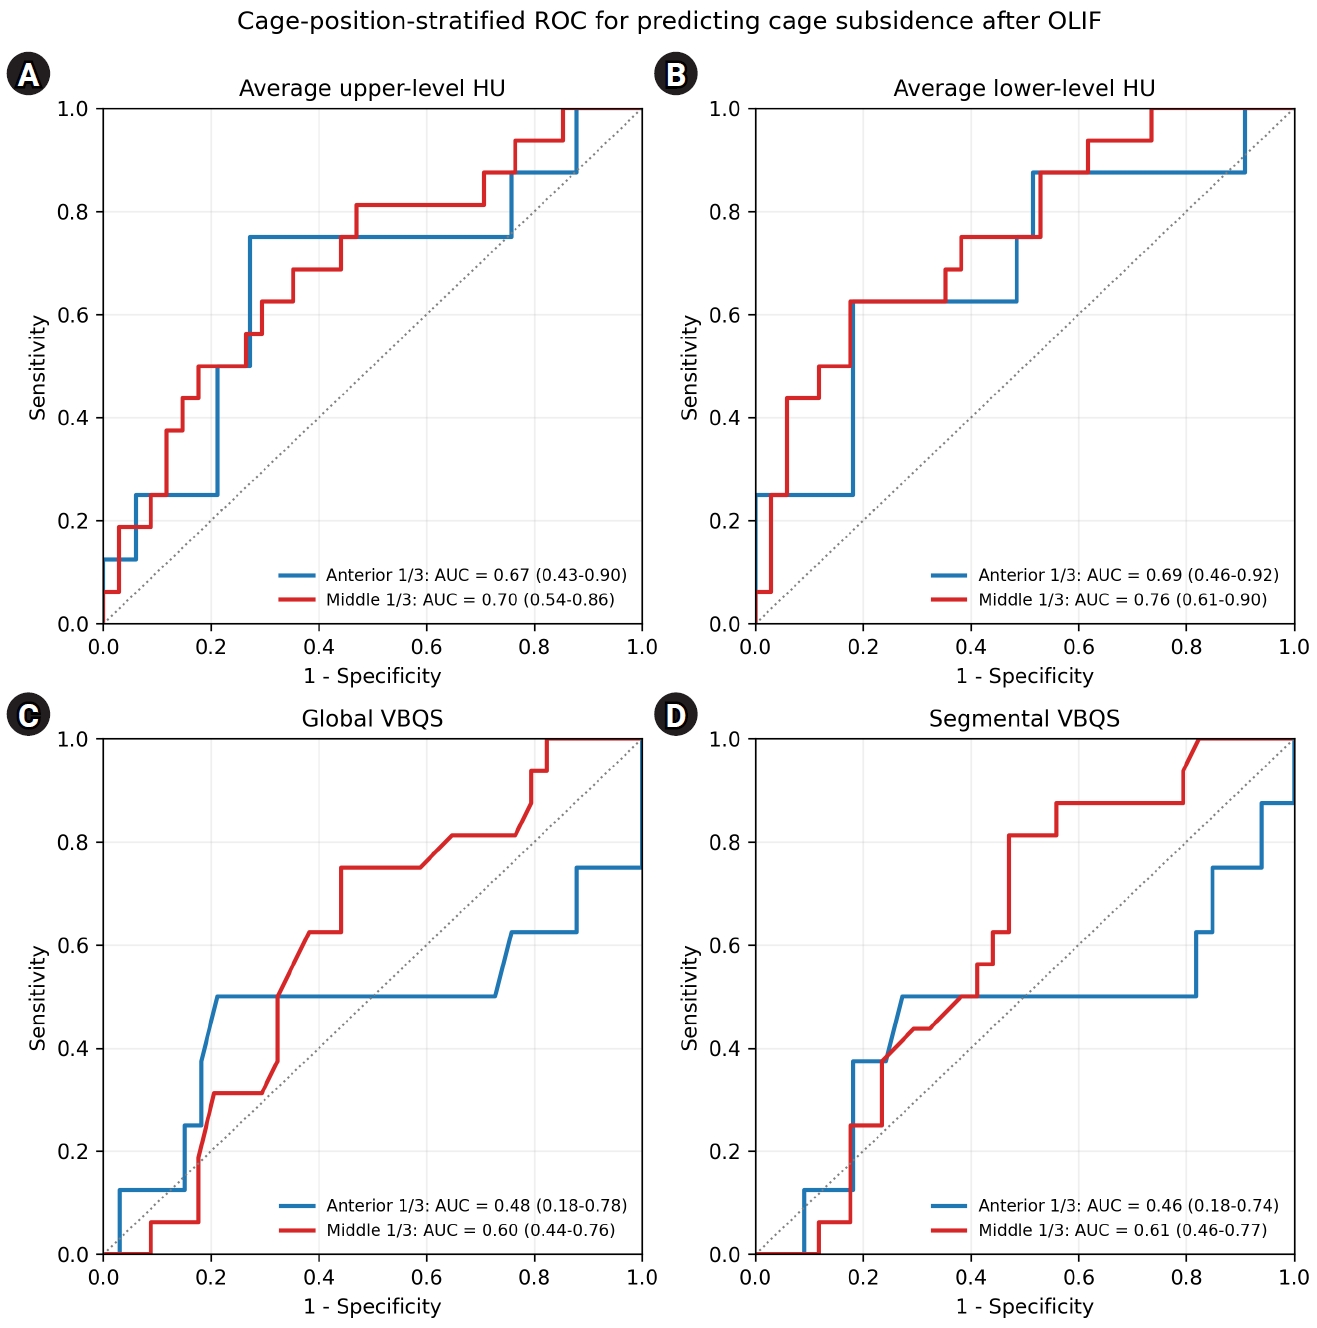
When restricted to the middle-placement subgroup, lower-instrumented-vertebra HU produced the highest point estimate of AUC (0.757; 95% CI, 0.613 to 0.902) and trended toward better discrimination than global VBQS on paired DeLong's testing (ΔAUC, +0.156; p=0.098). In the anterior-placement subgroup, HU AUC values remained > 0.66, whereas global and segmental VBQS AUC values fell at or below 0.50 (0.477 and 0.460, respectively)—i.e., at chance level. Between-position DeLong tests for each predictor did not reach significance (lower-instrumented-vertebra HU p=0.644; segmental VBQS p=0.350), but the discrimination of VBQS-based scores was numerically more than 0.10 higher in middle than in anterior placements. The position-stratified receiver operating characteristic curves are presented in Fig. 2.
5. Multivariable logistic regression
In reduced multivariable models adjusted for age, L5–S1 level, and cage position, each one-standard-deviation decrease in lower-instrumented-vertebra HU was independently associated with cage subsidence (adjusted OR, 0.40; 95% CI, 0.20 to 0.81; p=0.011), as was each one-standard-deviation decrease in upper-instrumented-vertebra HU (adjusted OR, 0.49; 95 % CI, 0.25 to 0.98; p=0.042). Neither global VBQS (adjusted OR, 1.07; 95% CI, 0.57 to 2.01; p=0.843) nor segmental VBQS (adjusted OR, 1.08; 95% CI, 0.59 to 2.00; p=0.796) was independently associated with cage subsidence (Table 3, Supplementary Fig. S1).
In the pre-specified primary interaction model, the lower-instrumented-vertebra HU×cage-position interaction term was not statistically significant (interaction OR, 0.70; 95% CI, 0.21 to 2.31; p=0.55). Position-stratified adjusted ORs derived from this model nonetheless showed a clear gradient: in middle-placed cages, each one-standard-deviation decrease in lower-instrumented-vertebra HU was associated with a roughly threefold increase in odds of subsidence (adjusted OR, 0.345; 95% CI, 0.150 to 0.792; p=0.012), whereas in anterior-placed cages the same effect was attenuated and not significant (adjusted OR, 0.50; 95% CI, 0.18 to 1.40; p=0.185). Stratified ORs for upper-instrumented-vertebra HU showed a similar but weaker pattern. For both VBQS formulations, stratified ORs in the anterior subgroup pointed in the opposite direction to the prevailing biological hypothesis (anterior global VBQS adjusted OR, 0.77; anterior segmental VBQS adjusted OR, 0.67) and were not significant (Table 3).
6. Sensitivity analyses
Refitting all models with model-based standard errors that ignored patient-level clustering produced concordant point estimates and p-value patterns. Excluding the L1–L2 case and the five L5–S1 cases did not change the direction or magnitude of any reported estimate. When the analysis was repeated using the posterior-disc-height-only outcome, the event count fell to 21 of 91 levels (23.1%), agreement with the original outcome was 72.5%, and all main-effect and interaction estimates moved toward the null and lost statistical significance (lower-instrumented-vertebra HU adjusted OR, 0.75; p=0.267 and global VBQS adjusted OR, 1.19; p=0.469) (Supplementary Table S1 for full details).
Discussion
In this 1- to 2-level OLIF cohort, lower-instrumented-vertebra HU was an independent predictor of cage subsidence after adjustment for age, surgical level, and patient-level clustering, while neither the global nor the segmental VBQS score remained associated with subsidence in adjusted models. The HU effect was largely driven by cages placed in the middle one-third of the vertebral body—in this subgroup, each one-standard-deviation drop in lower-instrumented-vertebra HU roughly tripled the adjusted odds of subsidence (adjusted OR, 0.345; p=0.012), while in cages placed in the anterior one-third the same association was weaker and not statistically significant. The formal interaction term did not reach significance, which we attribute to the small number of subsidence events available for an effect-modification analysis; we therefore present the position-stratified findings as descriptive rather than confirmatory.
The whole-cohort AUC of 0.72 for lower-instrumented-vertebra HU, with a Youden cut-off near 102 HU, sits within the range previously reported for OLIF (AUC, 0.65 to 0.91; threshold 113 to 146 HU).6,12-14,17) The slightly lower threshold here is most likely explained by an older mean age (69 years) and by the strict 1- to 2-level inclusion criterion. The adjusted independent association between HU and subsidence fits the well-established correlation between vertebral HU and bone mineral density and the clinical observation that low trabecular density predisposes the endplate to failure under axial cage loading.4,9,10) Consistent with this, the subsidence group was enriched for osteoporosis-range bone density on the opportunistic surrogate (62.5% vs. 25.4% below 110 HU). Because this value is obtained from the same preoperative CT at no additional cost or radiation, HU can serve a dual role—opportunistically flagging low bone status when dual-energy X-ray absorptiometry is unavailable, and stratifying subsidence risk.
Our findings regarding VBQS contrast with those of previous studies. Huang et al.,15) Soliman et al.,16) and Pu et al.17) have all found VBQS to predict subsidence after OLIF or transforaminal lumbar interbody fusion. The position-stratified analysis offers one explanation. VBQS AUC fell to chance (≤0.50) in the anterior-cage subgroup but rose to roughly 0.60 in the middle-cage subgroup, mirroring the HU pattern. When the cage is anchored on the apophyseal ring and the anterior cortical endplate, a whole-vertebral-body marrow signal may simply be decoupled from the actual cage-endplate interface, and its predictive value is lost. This view is in keeping with the recent observation that regional endplate-specific HU measurements—both at the epiphyseal ring and at the central endplate—independently predict intraoperative endplate violation and delayed cage subsidence after OLIF.21) The VBQS formulation we used (mean L1–L5 signal, per the original Ehresman protocol) also differs from the L1–L4 median version used in some prior series; we kept the L1–L5 mean form because it had been pre-specified for this dataset.
The current analysis substantially overlaps with our group's recently published 119-level OLIF cohort study.18) The two analyses, however, ask different questions and were designed differently. Koo et al.18) examined the joint contribution of HU, VBQS, and posterior disc-height distraction in the full cohort using a posterior-disc-height-only outcome, and reported all three as independent predictors. We instead asked whether cage placement position modifies the predictive performance of bone-quality measures, kept upper- and lower-instrumented-vertebra HU separate, and used a broader, pre-specified outcome that captured both vertical settling and endplate violation. In this subset, the two outcome definitions classified only 72.5% of levels the same way. When we repeated the analysis with the posterior-disc-height-only outcome, every association attenuated toward the null—pointing in the same direction observed in the larger cohort but no longer reaching significance at this smaller sample size. The two studies should therefore be read as complementary rather than competing: the 119-level analysis with the narrower outcome shows VBQS to be a useful preoperative measure on average, while this 91-level subset with the broader outcome adds that the measure's usefulness depends on where the cage ultimately ends up.
Cage position is also related to the overall frequency of subsidence: subsidence occurred less often with anterior-third placement (19.5%, 8/41) than middle-third placement (32.0%, 16/50), although this difference was not statistically significant (p=0.27). The direction is nonetheless biomechanically coherent. Cadaveric indentation mapping has shown the central region of the lumbar endplate—where a middle-third cage bears—to be the weakest part, whereas the peripheral and posterolateral endplate engaged by anterior, apophyseal-ring-supported placement is markedly stronger and stiffer.22) Anterior placement may therefore resist axial cage loading relatively independently of trabecular density, consistent with the attenuated HU association we observed in anteriorly placed cages. Taken together, these observations provide a tentative rationale for favouring anterior, apophyseal-ring-supported cage placement when the surgical corridor and endplate anatomy allow—particularly in patients with low preoperative HU—although the cohort is underpowered for this comparison and the suggestion remains hypothesis-generating.
For the operating surgeon, these findings argue for considering planned cage placement when interpreting preoperative bone-quality measurements. When middle-one-third placement is anticipated—for example, where lateral osteophytes compromise the apophyseal ring or where access constraints prevent an anterior trajectory—a low lower-instrumented-vertebra HU value (Youden cut-off near 100 HU in this cohort) appears to be the most informative single preoperative red flag for subsidence. When anterior placement is feasible, the same bone-quality value seems to carry less weight, although this last observation remains hypothesis-generating in the absence of an adequately powered formal interaction test.
This study has several limitations. First, it is retrospective, single-centre, and single-surgeon, with 24 subsidence events. The events-per-variable ratio of approximately six supports the adjusted main effects but limits power to detect formal effect modification, which is reflected in the non-significant interaction term despite consistent stratified estimates. Second, important covariates—sex, body mass index, dual-energy X-ray absorptiometry T-score, antiresorptive or anabolic therapy, and patient-reported outcomes—were not available and could not be adjusted for; we mitigated the absence of densitometry with an HU-based opportunistic surrogate, but this cannot replace a formal T-score or pharmacological history. Third, all radiographic measurements—HUs, vertebral bone quality scores, and cage placement position—were performed by a single observer without formal inter- or intra-observer reliability testing, and outcome adjudication was not blinded with respect to baseline imaging. Fourth, patient-level clustering had to be reconstructed from the pre-specified analytic dataset; the cluster-robust and naive sensitivity analyses pointed in the same direction. Fifth, this cohort overlaps substantially with our group's previously reported 119-level study; the overlap was addressed by pre-specifying a different outcome and primary aim, and is disclosed explicitly throughout the manuscript.18)
In conclusion, lower-instrumented-vertebra HU was an independent predictor of cage subsidence after 1- to 2-level OLIF, with the strongest discrimination in cages placed in the middle one-third of the vertebral body. Cage placement position may therefore warrant consideration when interpreting preoperative bone-quality measures for OLIF surgical planning.
The authors have no conflicts of interest to declare.
Funding
None.
Acknowledgments
Statistical-pipeline scaffolding and language editing of this manuscript were assisted by Claude Opus 4.8 (Anthropic, San Francisco, CA, USA), under direct author supervision; No artificial-intelligence-generated material was used as a primary source.
Forest plot of position-stratified adjusted odds ratios from the cage-position interaction model, with cluster-robust standard errors on the patient identifier. Each row shows the adjusted odds ratio (95% confidence interval) per one standard-deviation change in the bone-quality predictor (decrease for Hounsfield unit [HU]; increase for vertebral bone quality score [VBQS]), within the indicated cage-placement subgroup, derived from the corresponding predictor×cage-position interaction model. Vertical dotted line indicates the null value (odds ratio [OR], 1). The same numerical estimates are presented in Table 3 of the main manuscript.
Classification of intraoperative cage placement position. (A) Anterior one-third placement: the cage occupies the anterior third of the inferior endplate of the upper instrumented vertebra and engages the dense apophyseal ring. (B) Middle one-third placement: the cage rests in the middle third of the inferior endplate, where it bears on the central trabecular bone. Cage placement was categorised on immediate-postoperative lateral radiographs by dividing the inferior endplate of the upper instrumented vertebra into equal thirds and assigning the cage to the zone containing its mid-sagittal geometric center.
Fig. 2.
Cage-position-stratified receiver-operating-characteristic (ROC) curves for predicting cage subsidence after 1- to 2-level oblique lumbar interbody fusion (OLIF). Each panel overlays the ROC curve in the anterior one-third cage subgroup (n=41; 8 subsidence events) on that of the middle one-third cage subgroup (n=50; 16 subsidence events) for one preoperative bone-quality predictor. Areas under the receiver-operating-characteristic curve (AUC) are reported with 95% confidence intervals computed by the DeLong method. (A) Average upper-instrumented-vertebra Hounsfield unit (HU) value. (B) Average lower-instrumented-vertebra HU value. (C) Global vertebral bone quality score (VBQS). (D) Segmental VBQS. The diagonal grey dotted line represents the line of no discrimination.
Table 1.
Baseline characteristics, radiographic parameters, and disc-height loss, by subsidence status—whole cohort and stratified by cage placement position
Values are presented as mean±standard deviation or number (%).
HU: Hounsfield unit, VBQS: vertebral bone quality score.
a)Mann-Whitney U test,
b)Pearson's chi-square test,
c)Opportunistic-screening surrogate of bone status from the mean Hounsfield unit value at the lower instrumented vertebra (osteoporosis-range <110 HU; low-bone-mass range 110–159 HU; normal-range ≥160 HU); dual-energy X-ray absorptiometry was not available in this retrospective cohort,
d)Welch’s t-test.
Table 2.
Receiver-operating-characteristic analysis for predicting cage subsidence—whole cohort and stratified by cage placement position
Pairwise DeLong's tests within the whole cohort: lower- vs. upper-instrumented-vertebra HU ΔAUC=+0.037, p=0.481; lower-instrumented-vertebra HU vs. global VBQS ΔAUC=+0.152, p=0.101; lower-instrumented-vertebra HU vs. segmental VBQS ΔAUC=+0.146, p=0.104. Between-position DeLong's tests (anterior versus middle, per predictor): upper-instrumented-vertebra HU p=0.837; lower-instrumented-vertebra HU p=0.644; global VBQS p=0.475; segmental VBQS p=0.350. Paired DeLong's test within the middle subgroup: lower-instrumented-vertebra HU vs. global VBQS ΔAUC=+0.156, p=0.098. AUC: area under the receiver-operating-characteristic curve, CI: confidence interval, PPV: positive predictive value, NPV: negative predictive value, HU: Hounsfield unit, VBQS: vertebral bone quality score.
a)Threshold determined by the maximum Youden index. Rule direction: "≤" for HU (event=low HU) and "≥" for VBQS (event=high VBQS).
Table 3.
Multivariable logistic regression—adjusted ORs for cage subsidence with cluster-robust standard errors on the patient identifier
OR: odds ratio, SD: standard deviation, CI: confidence interval, HU: Hounsfield unit, VBQS: vertebral bone quality score.
a)From a reduced model adjusting for age, L5–S1 level, cage position, and the bone-quality predictor (no interaction term),
b)From the corresponding interaction model that additionally included a predictor×cage-position term, with cluster-robust standard errors propagated,
c)Wald p-value of the predictor×cage-position interaction term,
d)Estimate is in the opposite direction to the prevailing biological hypothesis (i.e. higher VBQS associated with lower odds of subsidence in the anterior subgroup), and the 95% CI crosses 1.0.
References
1. Park J, Park SM, Han S, Jeon Y, Hong JY. Factors affecting successful immediate indirect decompression in oblique lateral interbody fusion in lumbar spinal stenosis patients. N Am Spine Soc J 2023;16:100279.
2. Lee WM, You KH, Kang MS, Kim JH, Park HJ. Oblique lumbar interbody fusion with selective biportal endoscopic posterior decompression for multilevel lumbar degenerative diseases. Asian Spine J 2023;17:392-400.
3. Fujibayashi S, Takemoto M, Ishii K, et al. Multicenter prospective study of lateral lumbar interbody fusions using bioactive porous titanium spacers without bone grafts. Asian Spine J 2022;16:890-7.
4. Oh KW, Lee JH, Lee JH, Lee DY, Shim HJ. The correlation between cage subsidence, bone mineral density, and clinical results in posterior lumbar interbody fusion. Clin Spine Surg 2017;30:E683-9.
5. Shen S, You X, Ren Y, Ye S. Risk factors of cage subsidence following oblique lumbar interbody fusion: a meta-analysis and systematic review. World Neurosurg 2024;183:180-6.
6. Zhou J, Yuan C, Liu C, Zhou L, Wang J. Hounsfield unit value on CT as a predictor of cage subsidence following stand-alone oblique lumbar interbody fusion for the treatment of degenerative lumbar diseases. BMC Musculoskelet Disord 2021;22:960.
8. Muraki S, Yamamoto S, Ishibashi H, et al. Impact of degenerative spinal diseases on bone mineral density of the lumbar spine in elderly women. Osteoporos Int 2004;15:724-8.
9. Schreiber JJ, Anderson PA, Rosas HG, Buchholz AL, Au AG. Hounsfield units for assessing bone mineral density and strength: a tool for osteoporosis management. J Bone Joint Surg Am 2011;93:1057-63.
10. Lee S, Chung CK, Oh SH, Park SB. Correlation between bone mineral density measured by dual-energy X-ray absorptiometry and Hounsfield units measured by diagnostic CT in lumbar spine. J Korean Neurosurg Soc 2013;54:384-9.
11. Ehresman J, Pennington Z, Schilling A, et al. Novel MRI-based score for assessment of bone density in operative spine patients. Spine J 2020;20:556-62.
12. Ran L, Xie T, Zhao L, Huang S, Zeng J. Low Hounsfield units on computed tomography are associated with cage subsidence following oblique lumbar interbody fusion (OLIF). Spine J 2022;22:957-64.
14. Xi Z, Mummaneni PV, Wang M, et al. The association between lower Hounsfield units on computed tomography and cage subsidence after lateral lumbar interbody fusion. Neurosurg Focus 2020;49:E8.
15. Huang Y, Chen Q, Liu L, Feng G. Vertebral bone quality score to predict cage subsidence following oblique lumbar interbody fusion. J Orthop Surg Res 2023;18:258.
17. Pu X, Wang X, Ran L, et al. Comparison of predictive performance for cage subsidence between CT-based Hounsfield units and MRI-based vertebral bone quality score following oblique lumbar interbody fusion. Eur Radiol 2023;33:8637-44.
19. von Elm E, Altman DG, Egger M, et al. The Strengthening the Reporting of Observational Studies in Epidemiology (STROBE) statement: guidelines for reporting observational studies. Lancet 2007;370:1453-7.
20. DeLong ER, DeLong DM, Clarke-Pearson DL. Comparing the areas under two or more correlated receiver operating characteristic curves: a nonparametric approach. Biometrics 1988;44:837-45.
21. Wu H, Cheung JP, Zhang T, et al. The role of Hounsfield unit in intraoperative endplate violation and delayed cage subsidence with oblique lateral interbody fusion. Global Spine J 2023;13:1829-39.
Preoperative Hounsfield Unit Values, Cage Placement Position, and Cage Subsidence after Oblique Lumbar Interbody Fusion: A Retrospective Cohort Study
Fig. 1. Classification of intraoperative cage placement position. (A) Anterior one-third placement: the cage occupies the anterior third of the inferior endplate of the upper instrumented vertebra and engages the dense apophyseal ring. (B) Middle one-third placement: the cage rests in the middle third of the inferior endplate, where it bears on the central trabecular bone. Cage placement was categorised on immediate-postoperative lateral radiographs by dividing the inferior endplate of the upper instrumented vertebra into equal thirds and assigning the cage to the zone containing its mid-sagittal geometric center.
Fig. 2. Cage-position-stratified receiver-operating-characteristic (ROC) curves for predicting cage subsidence after 1- to 2-level oblique lumbar interbody fusion (OLIF). Each panel overlays the ROC curve in the anterior one-third cage subgroup (n=41; 8 subsidence events) on that of the middle one-third cage subgroup (n=50; 16 subsidence events) for one preoperative bone-quality predictor. Areas under the receiver-operating-characteristic curve (AUC) are reported with 95% confidence intervals computed by the DeLong method. (A) Average upper-instrumented-vertebra Hounsfield unit (HU) value. (B) Average lower-instrumented-vertebra HU value. (C) Global vertebral bone quality score (VBQS). (D) Segmental VBQS. The diagonal grey dotted line represents the line of no discrimination.
Fig. 1.
Fig. 2.
Preoperative Hounsfield Unit Values, Cage Placement Position, and Cage Subsidence after Oblique Lumbar Interbody Fusion: A Retrospective Cohort Study
Variable
Subsidence
Non-subsidence
p-value
Whole cohort
24
67
Age (years)
73.04±9.92
67.49±7.80
<0.001a)
Operative level
0.324b)
L1–L2
0 (0)
1 (1.5)
L2–L3
5 (20.8)
13 (19.4)
L3–L4
11 (45.8)
27 (40.3)
L4–L5
5 (20.8)
24 (35.8)
L5–S1
3 (12.5)
2 (3.0)
Cage position
0.269b)
Anterior 1/3
8 (33.3)
33 (49.3)
Middle 1/3
16 (66.7)
34 (50.7)
Cage obliquity (°)
8.03±6.06
8.38±6.85
0.390a)
Average upper-instrumented-vertebra HU
107.04±48.76
144.47±63.61
0.007a)
Average lower-instrumented-vertebra HU
111.47±53.47
158.75±65.51
0.001a)
Lower-vertebra HU status (opportunistic surrogate)c)
0.002b)
Osteoporosis-range (<110 HU)
15 (62.5)
17 (25.4)
Osteopenia-range (110–159 HU)
6 (25.0)
18 (26.9)
Normal-range (≥160 HU)
3 (12.5)
32 (47.8)
Global VBQS
3.38±0.66
3.24±0.71
0.309a)
Segmental VBQS
3.47±0.70
3.31±0.81
0.270a)
Disc-height loss at 1 year (mm)
2.16±2.52
1.46±1.40
0.195a)
Anterior 1/3 cage subgroup
8
33
Age (years)
75.25±6.80
67.67±7.90
0.005a)
Cage obliquity (°)
6.76±4.80
8.25±6.93
0.270a)
Average upper-instrumented-vertebra HU
108.22±54.76
143.24±67.93
0.155a)
Average lower-instrumented-vertebra HU
112.21±65.22
146.92±56.19
0.197d)
Global VBQS
3.18±0.85
3.20±0.60
0.856a)
Segmental VBQS
3.23±0.81
3.29±0.68
0.862d)
Middle 1/3 cage subgroup
16
34
Age (years)
71.94±11.20
67.32±7.82
0.028a)
Cage obliquity (°)
8.71±6.69
8.50±6.87
0.803a)
Average upper-instrumented-vertebra HU
106.45±47.38
145.67±60.12
0.017d)
Average lower-instrumented-vertebra HU
111.11±48.98
170.23±72.42
0.002d)
Global VBQS
3.48±0.54
3.29±0.80
0.327d)
Segmental VBQS
3.59±0.64
3.34±0.93
0.276d)
Predictor
AUC (95% CI)
Thresholda)
Sensitivity
Specificity
PPV
NPV
Whole cohort (n=91, 24 events)
Upper-instrumented-vertebra HU
0.685 (0.556–0.814)
≤103
0.667
0.701
0.444
0.855
Lower-instrumented-vertebra HU
0.723 (0.602–0.843)
≤102
0.625
0.821
0.556
0.859
Global VBQS
0.571 (0.429–0.712)
≥3.53
0.583
0.687
0.400
0.821
Segmental VBQS
0.576 (0.441–0.712)
≥3.16
0.708
0.507
0.340
0.829
Anterior 1/3 cage subgroup (n=41, 8 events)
Upper-instrumented-vertebra HU
0.667 (0.430–0.904)
≤99
0.750
0.727
0.400
0.923
Lower-instrumented-vertebra HU
0.693 (0.462–0.924)
≤99
0.625
0.818
0.455
0.900
Global VBQS
0.477 (0.179–0.775)
≥3.60
0.500
0.788
0.364
0.867
Segmental VBQS
0.460 (0.177–0.743)
≥3.64
0.500
0.727
0.308
0.857
Middle 1/3 cage subgroup (n=50, 16 events)
Upper-instrumented-vertebra HU
0.697 (0.536–0.857)
≤132
0.812
0.529
0.448
0.857
Lower-instrumented-vertebra HU
0.757 (0.613–0.902)
≤102
0.625
0.824
0.625
0.824
Global VBQS
0.601 (0.438–0.764)
≥3.21
0.750
0.559
0.444
0.826
Segmental VBQS
0.615 (0.456–0.774)
≥3.16
0.812
0.529
0.448
0.857
Bone-quality predictor (per 1 SD)
Whole cohorta)
Anterior 1/3 cageb) (n=41, 8 events)
Middle 1/3 cageb) (n=50, 16 events)
Interaction p-valuec)
Adjusted OR (95% CI)
p-value
Adjusted OR (95% CI)
p-value
Adjusted OR (95% CI)
p-value
Lower-instrumented-vertebra HU (per 1 SD ↓)
0.40 (0.20–0.81)
0.011
0.50 (0.18–1.40)
0.185
0.345 (0.150–0.792)
0.012
0.553
Upper-instrumented-vertebra HU (per 1 SD ↓)
0.49 (0.25–0.98)
0.042
0.50 (0.19–1.33)
0.167
0.48 (0.20–1.17)
0.108
0.953
Global VBQS (per 1 SD ↑)
1.07 (0.57–2.01)
0.843
0.77 (0.24–2.48)
0.662d)
1.28 (0.72–2.27)
0.403
0.389
Segmental VBQS (per 1 SD ↑)
1.08 (0.59–2.00)
0.796
0.67 (0.20–2.27)
0.520d)
1.33 (0.74–2.38)
0.340
0.270
Table 1. Baseline characteristics, radiographic parameters, and disc-height loss, by subsidence status—whole cohort and stratified by cage placement position
Values are presented as mean±standard deviation or number (%).
HU: Hounsfield unit, VBQS: vertebral bone quality score.
Mann-Whitney U test,
Pearson's chi-square test,
Opportunistic-screening surrogate of bone status from the mean Hounsfield unit value at the lower instrumented vertebra (osteoporosis-range <110 HU; low-bone-mass range 110–159 HU; normal-range ≥160 HU); dual-energy X-ray absorptiometry was not available in this retrospective cohort,
Welch’s t-test.
Table 2. Receiver-operating-characteristic analysis for predicting cage subsidence—whole cohort and stratified by cage placement position
Pairwise DeLong's tests within the whole cohort: lower- vs. upper-instrumented-vertebra HU ΔAUC=+0.037, p=0.481; lower-instrumented-vertebra HU vs. global VBQS ΔAUC=+0.152, p=0.101; lower-instrumented-vertebra HU vs. segmental VBQS ΔAUC=+0.146, p=0.104. Between-position DeLong's tests (anterior versus middle, per predictor): upper-instrumented-vertebra HU p=0.837; lower-instrumented-vertebra HU p=0.644; global VBQS p=0.475; segmental VBQS p=0.350. Paired DeLong's test within the middle subgroup: lower-instrumented-vertebra HU vs. global VBQS ΔAUC=+0.156, p=0.098. AUC: area under the receiver-operating-characteristic curve, CI: confidence interval, PPV: positive predictive value, NPV: negative predictive value, HU: Hounsfield unit, VBQS: vertebral bone quality score.
Threshold determined by the maximum Youden index. Rule direction: "≤" for HU (event=low HU) and "≥" for VBQS (event=high VBQS).
Table 3. Multivariable logistic regression—adjusted ORs for cage subsidence with cluster-robust standard errors on the patient identifier
OR: odds ratio, SD: standard deviation, CI: confidence interval, HU: Hounsfield unit, VBQS: vertebral bone quality score.
From a reduced model adjusting for age, L5–S1 level, cage position, and the bone-quality predictor (no interaction term),
From the corresponding interaction model that additionally included a predictor×cage-position term, with cluster-robust standard errors propagated,
Wald p-value of the predictor×cage-position interaction term,
Estimate is in the opposite direction to the prevailing biological hypothesis (i.e. higher VBQS associated with lower odds of subsidence in the anterior subgroup), and the 95% CI crosses 1.0.