1)Department of Orthopaedic Surgery, Yonsei University College of Medicine, Seoul, Korea
2)Department of Mechanical and Biomedical Engineering, Ewha Womans University, Graduate Program in Smart Factory
Corresponding author: Ji-Won Kwon, M.D., Ph.D. Department of Orthopaedic Surgery, Yonsei University College of Medicine, 50 Yonsei-ro, Seodaemun-gu, Seoul, 03722 Korea TEL: +82-2-2019-3411, FAX: +82-2-2019-3410 E-mail: kwonjjanng@yuhs.ac
This is an open access article distributed under the terms of the Creative Commons Attribution Non-Commercial License (http://creativecommons.org/licenses/by-nc/4.0/) which permits unrestricted non-commercial use, distribution, and reproduction in any medium, provided the original work is properly cited.
Metabolic syndrome is a multifactorial condition associated with increased risks of cardiovascular disease and type 2 diabetes. This study aims to evaluate whether combining AI-based abdominal CT metrics with traditional InBody analysis enhances the prediction of metabolic syndrome.
Materials and Methods
This retrospective study included 977 adults who underwent both abdominal CT and InBody assessments. AI-derived measurements were obtained using a deep-learning V-Net model trained to segment seven body tissue types. InBody measurements included BMI, body fat percentage, fat mass, and waist-hip ratio. Metabolic syndrome was defined by NCEP-ATP III criteria. Logistic regression and ROC analyses were used to evaluate the predictive performance of AI-derived metrics, InBody metrics, and their combination.
Results
Body fat percentage and waist-hip ratio from InBody analysis were strong predictors of metabolic syndrome (AUC 0.82). AI-derived visceral fat was also significantly associated with metabolic syndrome (AUC 0.61). Combining both AI and InBody metrics slightly improved predictive performance (AUC 0.83), indicating a complementary diagnostic value.
Conclusions
While InBody metrics remain superior in predicting metabolic syndrome due to their close association with metabolic processes, AI-derived body composition metrics, particularly visceral fat, offer structural insights. The modest improvement in prediction when combined suggests the potential of an integrated diagnostic model in clinical practice.
대사증후군은 심혈관 질환 및 제2형 당뇨병의 발생 위험을 높이는 복합적 질환으로, 본 연구는 AI 기반 복부 CT 분석과 전통적인 InBody 분석의 결합이 대사증후군 예측에 있어 상보적인 역할을 수행하는지를 평가하고자 하였다.
대상 및 방법
2023년 1월부터 9월까지 건강검진을 받은 성인 977명을 후향적으로 분석하였다. 모두 복부 CT와 InBody 검사를 시행받았으며, AI 기반 측정은 복부 CT에서 V-Net 딥러닝 모델을 통해 7개의 조직을 자동 분할하여 얻었다. InBody 측정치는 BMI, 체지방률, 지방량, 허리-엉덩이 비(Waist-Hip Ratio)를 포함하였다. 대사증후군은 NCEP-ATP III 기준에 따라 정의되었으며, 로지스틱 회귀분석과 ROC 곡선을 통해 각 모델의 예측 성능을 비교하였다.
결과
InBody 기반 체지방률 및 허리-엉덩이 비는 대사증후군 예측에 있어 높은 성능을 보였으며(AUC 0.82), AI 기반 복부 내장지방 또한 유의한 예측 변수로 작용하였다(AUC 0.61). 두 분석법을 결합한 모델은 AUC 0.83으로 소폭 향상된 예측력을 보였으며, 이는 두 방법의 상보적 진단 가치를 시사한다.
결론
InBody 분석은 대사증후군의 대사적 과정과 밀접하게 연관되어 예측력이 우수하지만, AI 기반 CT 분석은 특히 내장지방 분포에 대한 구조적 통찰을 제공한다. 두 분석법의 통합은 예측 정확도를 소폭 향상시키며, 향후 임상 진단에서의 활용 가능성을 제시한다.
Metabolic syndrome is a constellation of interrelated risk factors that predispose individuals to cardiovascular disease, type 2 diabetes, and other severe health conditions.10,16,28) These risk factors include central obesity, elevated blood pressure, dyslipidemia, and insulin resistance, which together increase morbidity and mortality globally. With the growing prevalence of metabolic syndrome, particularly in aging populations, there is an urgent need for precise diagnostic tools that can enable early detection and intervention.10) Traditionally, body composition has been assessed through bioelectrical impedance analysis (BIA), particularly using devices like InBody. These devices measure key parameters, including body fat percentage, lean muscle mass, and the waist-hip ratio (WHR), which have been widely accepted as functional indicators of metabolic health.3) InBody metrics are closely linked to metabolic processes and have proven effective in predicting metabolic syndrome by providing insights into an individual’s fat and muscle distribution, along with their metabolic risk profile.19,23) In parallel, advancements in artificial intelligence (AI) and medical imaging technologies, particularly computed tomography (CT) scans, have introduced new avenues for body composition analysis.21) AI-driven systems can automatically quantify the volumes of skeletal muscle, subcutaneous fat, visceral fat, and other body tissues, providing a more granular and precise assessment of an individual’s body composition.26) Unlike InBody metrics, which are based on bioelectrical properties and metabolic functions, AI-derived measurements offer spatial and volumetric insights into the structural makeup of the body, including the distribution of fat in different regions and the exact volume of muscle mass.1,7)
While both AI-derived metrics and InBody measurements provide valuable information independently, their integration could offer a more holistic view of a patient’s metabolic health. AI-derived imaging provides a deeper understanding of tissue distribution, while InBody metrics directly correlate with metabolic processes such as insulin sensitivity and lipid metabolism. The combination of these methods could therefore enhance the prediction of metabolic syndrome by leveraging the strengths of both imaging precision and functional bioelectrical analysis. Recent studies have shown the predictive power of AI-derived imaging in assessing musculoskeletal conditions and fat distribution, while InBody metrics remain a strong predictor of metabolic risk factors like central obesity and insulin resistance.8,17) However, few studies have explored the combined predictive value of these two approaches for metabolic syndrome. This study aims to fill this gap by investigating whether the integration of AI and InBody metrics can improve the diagnostic accuracy for metabolic syndrome. By comparing models that use AI-derived metrics, InBody metrics, and their combination, we hypothesize that the combined approach will provide superior predictive power compared to either method alone. Given the increasing burden of metabolic syndrome, particularly in populations with sedentary lifestyles and aging demographics, developing more accurate diagnostic tools is essential for preventing cardiovascular disease and diabetes. This study utilizes logistic regression models and ROC curve analysis to evaluate the effectiveness of AI-derived metrics, InBody metrics, and their combined predictive power in diagnosing metabolic syndrome.
Materials and Methods
1. Study design and population
This retrospective study analyzed a cohort of 977 adults who underwent routine health check-ups at a tertiary medical center between January and September 2023. Participants were included if they completed both bioelectrical impedance analysis (BIA) via InBody and abdominal computed tomography (CT) scans during their examination. Exclusion criteria included a history of significant musculoskeletal disorders, metabolic diseases, or any missing data related to the assessments. The study protocol was approved by the Institutional Review Board (IRB 3-2023-0263), and informed consent was waved for the nature of the study.
2. Body composition measurements: InBody metrics
Bioelectrical impedance analysis (BIA) was conducted using the InBody 720 device (Biospace Co., Ltd., Seoul, Korea) to assess body composition. The measurements included body mass index (BMI), which was calculated as weight in kilograms divided by height in meters squared (kg/m²), and soft lean mass (SLM), representing the weight of all nonfat and non-bone tissues. Additionally, body fat percentage (BodyFat), defined as the proportion of total body weight attributable to fat, and fat mass in kilograms (FatMassKg), the absolute weight of fat, were measured.13) The waist-hip ratio (WHRatio), calculated as the circumference of the waist divided by the circumference of the hips, was also obtained. These metrics were utilized in prediction models for metabolic syndrome, offering valuable insights into functional body composition and fat distribution.
3. Body composition measurements: AI-derived metrics
Body composition analysis was conducted using a deep-learning V-Net model, designed explicitly for three-dimensional (3D) segmentation tasks.31) The V-Net architecture, a volumetric extension of the well-known U-Net model, was optimized for segmenting seven key tissue types, including muscles and fat compartments, from abdominal and pelvic CT (APCT) images.29,30) The model leverages convolutional layers to capture both local and global relationships within 3D medical imaging data, ensuring robust segmentation even in anatomically complex regions. The V-Net model was trained using manually labeled ground truth data from 298 APCT scans. Labels were created by an experienced orthopedic surgeon using ITK-SNAP software (Version 3.8.0, ITK-SNAP, University of Pennsylvania and University of Utah, USA).33) These labels covered seven tissue classes. The segmentation included skeletal muscle (SM), which represents the total volume of core muscles essential for stability and movement, including major abdominal and back muscles. It also analyzed the psoas muscle (PM), a key muscle for spinal stabilization that plays a central role in maintaining posture,24) as well as the extensor spinalis muscle (ESM), which contributes to spinal extension and support. Additionally, the multifidus muscle (MFM),4) known for its role in fine spinal control and stabilization, was segmented. Regarding fat compartments, the analysis focused on subcutaneous fat (SAT), located beneath the skin and indicative of overall fat distribution, visceral fat (VAT), surrounding internal organs and strongly linked to metabolic risk factors such as insulin resistance and inflammation, and extraperitoneal fat (EAT), found outside the peritoneal cavity and providing additional insights into abdominal fat distribution.5,22)
4. Model training and validation
To prepare the dataset for model training, the APCT scans were pre-processed by resampling to an isotropic resolution of 1.5 mm, intensity normalization, and Hounsfield Unit (HU) range adjustments. Specifically, muscle tissues were segmented using the HU range of −29 to 150, while fat tissues were segmented within −50 to −150 HU. These pre-processing steps ensured uniform input for the V-Net model and minimized noise in the CT data.
The training process involved random sampling of 3D patches (size: 64×64×64) from labeled scans. The model was trained using Combo Loss, combining Dice loss and cross-entropy to enhance both precision and recall. Optimization was achieved using the Adam optimizer, with an initial learning rate of 0.01, adjusted via a Step scheduler (step size: 30 epochs; gamma: 0.1). The training dataset (80% of labeled data) and validation dataset (20% of labeled data) were used to ensure the model’s accuracy and generalizability. Once trained, the V-Net model was applied to 682 unlabeled APCT scans to generate automated segmentation masks. Entire CT volumes were reconstructed by aggregating patch-based predictions, resulting in segmentation masks for the seven tissue types. This automated process achieved an average Dice similarity coefficient (DSC) of 0.92 across all classes, highlighting the model’s high accuracy and reliability.
5. Metabolic syndrome diagnosis
Metabolic syndrome was diagnosed based on the criteria from the National Cholesterol Education Program Adult Treatment Panel III (NCEP-ATP III). The criteria include.12,20)
1. Central Obesity: Waist circumference >90 cm for men, > 80 cm for women.
2. Elevated Triglycerides: ≥150 mg/dL.
3. Reduced HDL Cholesterol: <40 mg/dL for men, <50 mg/dL for women.
The presence of at least three of these risk factors was required for a diagnosis of metabolic syndrome.
6. Statistical analyses
Logistic regression models were used to assess the predictive power of InBody metrics, AI-derived metrics, and their combination in diagnosing metabolic syndrome. Independent models were created using each set of metrics, and a combined model was constructed to evaluate the added predictive value of integrating both approaches. The models were evaluated using receiver operating characteristic (ROC) curves, and the area under the curve (AUC) was calculated to compare the diagnostic accuracy of each model. The primary outcome was the presence or absence of metabolic syndrome. Odds ratios (OR) with 95% confidence intervals (CI) were calculated for each predictor variable. Statistical significance was defined as p<0.05, and all analyses were conducted using SPSS Version 26 (IBM Corp., Armonk, NY, USA).
Results
1. Demographic data analysis
The study population consisted of 977 participants, with a mean age of 49.2±10.6 years. Of the participants, 52.4% were male (512 participants) and 47.6% were female (465 participants). The prevalence of metabolic syndrome in the cohort was 31.4% (307 participants), based on the NCEP-ATP III criteria. Table 1 summarizes the baseline characteristics of participants with and without metabolic syndrome.
2. InBody metrics and metabolic syndrome
InBody metrics were found to be strong predictors of metabolic syndrome. Body fat percentage (BodyFat) and waist-hip ratio (WHRatio) were particularly significant in distinguishing between participants with and without metabolic syndrome. Logistic regression analysis revealed that participants with higher BodyFat and WHRatio were significantly more likely to have metabolic syndrome (OR: 2.34, 95% CI: 1.88–2.92, p<0.001 for BodyFat; OR: 3.11, 95% CI: 2.54–3.78, p<0.001 for WHRatio). The AUC for the InBody model, based on these metrics, was 0.82, indicating strong predictive power.
3. AI-Derived metrics and metabolic syndrome
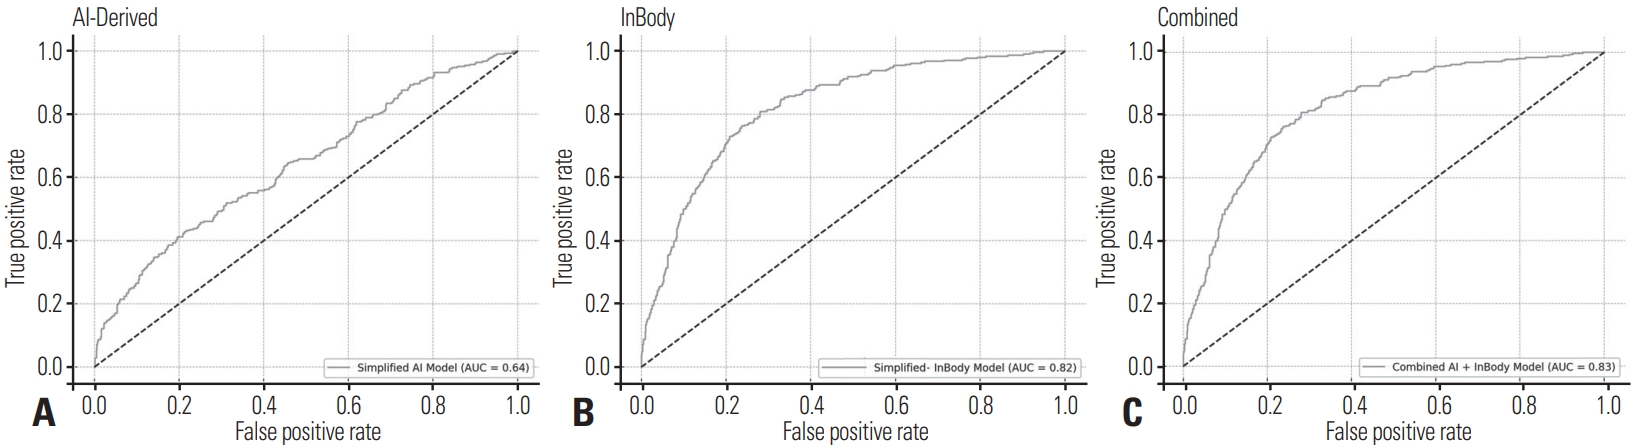
AI-derived metrics, including visceral fat (VAT) and subcutaneous fat (SAT), were also associated with metabolic syndrome, though the predictive power was somewhat lower than that of InBody metrics. Participants with higher visceral fat volume had increased odds of metabolic syndrome (OR: 1.68, 95% CI: 1.27–2.22, p=0.002), while subcutaneous fat showed a moderate protective effect (OR: 0.81, 95% CI: 0.70–0.95, p=0.01). The AUC for the AI model was 0.61, reflecting moderate predictive ability (Fig. 1).
4. Combined AI and InBody metrics
When combining both AI-derived and InBody metrics into a single predictive model, the diagnostic performance improved slightly, with an AUC of 0.83. The combined model demonstrated that integrating AI-derived measurements, particularly visceral fat, with InBody’s functional metrics like body fat percentage and waist-hip ratio, provides a more comprehensive prediction of metabolic syndrome (Fig. 1). While the improvement in predictive power was not substantial compared to the InBody metrics alone, the combined model may offer additional insights, particularly in cases where visceral fat distribution plays a significant role.
5. Logistic regression results
Table 2 presents the logistic regression coefficients for the independent and combined models. The significant predictors for metabolic syndrome in the InBody model included BodyFat and WHRatio (both p<0.001). In the AI model, visceral fat (p=0.002) and subcutaneous fat (p=0.01) were the strongest predictors. In the combined model, BodyFat (p<0.001), WHRatio (p<0.001), and visceral fat (p=0.002) remained significant predictors.
Discussion
Metabolic syndrome, a precursor to cardiovascular disease and type 2 diabetes, has emerged as one of the most prevalent and pressing public health concerns globally.25) Its early diagnosis is crucial in mitigating its progression into more severe health conditions.14) Traditional diagnostic tools, such as bioelectrical impedance analysis (BIA), particularly the InBody device, have been instrumental in predicting metabolic syndrome by measuring functional aspects of body composition. However, recent advancements in artificial intelligence (AI) and imaging technologies have opened new avenues for more precise and sophisticated body composition analysis.
AI has transformed the landscape of medical diagnostics across various fields, particularly in radiology and imaging. AI-driven models, especially those using deep-learning algorithms, have been applied to computed tomography (CT) scans to perform automatic segmentation and volumetric analysis of tissues, including muscle and fat. Recent research has demonstrated the utility of AI in accurately quantifying visceral fat and subcutaneous fat from imaging data, which are key indicators in the assessment of metabolic health. For instance, studies have shown that AI-based segmentation of abdominal CT scans can predict visceral fat volumes with high accuracy, which is particularly relevant for assessing cardiovascular risk factors like insulin resistance. In particular, deep-learning networks such as V-Net, used for volumetric segmentation of CT images, have been widely employed for this purpose. These networks enable the precise quantification of different body tissues, allowing for more detailed insights into fat distribution, especially in areas like visceral fat, which is strongly linked to metabolic syndrome.6,18) While InBody provides functional measurements such as body fat percentage and muscle mass through bioelectrical properties, AI-derived imaging data offer a structural and spatial understanding of fat and muscle distribution, which could complement traditional functional assessments.2)
The results of this study show that the integration of AI-derived metrics and InBody metrics provides only a modest improvement in the prediction of metabolic syndrome. Specifically, the combined model’s AUC increased by 0.01 (from 0.82 for the InBody model to 0.83 for the combined model). At first glance, this minor improvement may appear insignificant, but it highlights the complexity of integrating novel diagnostic technologies into routine clinical practice. The minimal increase in AUC can be attributed to the inherently different ways that InBody and AI-derived metrics capture body composition. InBody metrics, such as body fat percentage and waist-hip ratio, are directly linked to metabolic processes and thus remain powerful predictors of metabolic syndrome. These functional measures are well-established in the literature, with numerous studies demonstrating their close association with insulin resistance, hyperglycemia, and dyslipidemia, all of which are core components of metabolic syndrome.27) In contrast, AI-derived metrics, particularly those quantifying visceral and subcutaneous fat, provide high-resolution structural data. While visceral fat is known to be a strong predictor of metabolic syndrome, the mere volumetric quantification of fat and muscle may not fully capture the metabolic processes involved in the syndrome’s pathophysiology. This explains why the AI-derived model’s AUC was lower (0.61) compared to the InBody model’s AUC (0.82). Volumetric measures of fat and muscle do not account for the metabolic activities occurring in these tissues, which are critical in driving insulin resistance and other risk factors of metabolic syndrome.
Despite the modest improvement in AUC, the integration of AI-derived metrics still holds significant potential. The strength of combining AI-derived imaging data with functional InBody metrics lies in the ability to offer a comprehensive evaluation of body composition. While InBody metrics are closely related to metabolic processes, AI-derived metrics can provide added value, especially in cases where visceral fat plays a prominent role. For example, visceral fat is known to be a stronger predictor of metabolic syndrome compared to subcutaneous fat, as visceral fat secretes pro-inflammatory cytokines that contribute to insulin resistance and chronic inflammation.11) By integrating AIderived measures of visceral fat, the combined model offers a more detailed picture of a patient’s metabolic risk profile, particularly in cases where traditional InBody metrics might underestimate risk. This is particularly relevant in individuals with normal BMI but elevated visceral fat, a condition often referred to as normal weight obesity, which is increasingly recognized as a significant risk factor for metabolic syndrome.11) Furthermore, the modest improvement in AUC should not be discounted, as even small increases in predictive accuracy can translate into meaningful clinical outcomes when applied to large populations. In a high-risk population, identifying a small number of additional cases of metabolic syndrome through combined models could significantly impact public health by enabling earlier interventions and reducing the long-term burden of cardiovascular diseases and diabetes.32)
The application of AI-derived metrics in combination with traditional methods presents several exciting possibilities for the future of metabolic health diagnostics. While BIA-based tools such as InBody remain practical for routine clinical use, the incorporation of AI-driven imaging technologies could enhance risk stratification, particularly in specialized cases. For example, AI-based segmentation of visceral fat may provide valuable insights for patients with borderline metabolic syndrome or for those with hidden metabolic risk factors not captured by InBody metrics alone.9) However, challenges remain in translating these findings into everyday clinical practice. AI-derived imaging technologies, particularly those reliant on CT scans, are currently more resource-intensive and less accessible than BIA devices. Moreover, the use of ionizing radiation in CT scans raises concerns about routine application, especially for longitudinal monitoring. Therefore, future research should explore the development of AI algorithms that can be applied to lower-cost, lower-risk imaging modalities such as ultrasound or magnetic resonance imaging (MRI).
Additionally, the integration of machine learning models that combine not only body composition data from InBody and AI but also other clinical, genetic, and lifestyle factors could provide more robust and individualized risk predictions. Such models could enhance the early detection of metabolic syndrome and facilitate personalized interventions that are more effective in preventing cardiovascular disease and diabetes.8,15)
While this study provides valuable insights into the integration of AI and InBody metrics, several limitations must be acknowledged. First, the study population was relatively homogeneous, consisting primarily of individuals from a single medical center, which may limit the generalizability of the findings. Second, while the combined model showed a slight improvement in predictive power, the added complexity and cost of incorporating AI-derived imaging data must be weighed against the practical benefits in a clinical setting. Third, the cross-sectional nature of this study limits our ability to assess the long-term predictive value of AI-derived metrics in the progression of metabolic syndrome. Future studies should aim to include larger, more diverse populations and explore the application of AI-based body composition analysis in longitudinal settings to assess changes in metabolic risk over time. Additionally, efforts to reduce the cost and complexity of AI-driven imaging solutions will be crucial in making these technologies more widely accessible in clinical practice.
Conclusions
In summary, this study demonstrates the complementary roles of AI-derived body composition metrics and traditional InBody measurements in predicting metabolic syndrome. While InBody metrics remain the strongest predictors due to their close relationship with metabolic processes, the inclusion of AI-derived imaging data, particularly visceral fat quantification, offers additional insights that could refine diagnostic accuracy. Although the increase in AUC was modest, it highlights the potential of combining structural and functional assessments to improve risk prediction. Further research is needed to explore the integration of AI into clinical practice and develop more accessible imaging technologies for broader use.
NOTES
Ethical Review Committee Statement
This study was approved by our Institutional Review Board and Ethics Committee, which issued a waiver regarding the need for informed consent. And all studies were performed in accordance with relevant guidelines and regulations.
Fig. 1.
Receiver operating characteristic (ROC) curves for AI-derived, InBody, and combined models. (A) AI-derived model: The ROC curve illustrates the predictive performance of the AI-based model using CT-derived features, achieving an area under the curve (AUC) of 0.64. (B) InBody model with an AUC of 0.82. (C) Combined model with the highest AUC of 0.83.
Table 1.
Baseline characteristics of participants with and without metabolic syndrome. P-values for continuous variables were calculated using an independent t-test, while proportions, such as sex distribution, were analyzed using the chi-square test. MS is the abbreviation for metabolic syndrome
Metric Types
Variables
Group with MS (N=307)
Group without MS (n=670)
p-value
Patient Characteristics
Age (years)
52.1±8.3
45.6±7.5
<0.001
Sex (Male, %)
60%
45%
0.045
BMI (kg/m²)
29.3±3.5
24.8±2.7
<0.001
AI-Derived Metrics
Skeletal Muscle (SM) (cm³)
2,700±400
3,000±380
0.015
Psoas Muscle (PM) (cm³)
320±50
340±40
0.032
Extensor Spinalis Muscle (ESM) (cm³)
800±100
900±90
0.040
Multifidus Muscle (MFM) (cm³)
600±70
700±80
0.027
Subcutaneous Fat (SAT) (cm³)
240.4±60.1
320.1±70.3
<0.001
Visceral Fat (VAT) (cm³)
155.3±45.2
102.1±30.8
<0.001
InBody-Derived Metrics
Body Fat (%)
35.5±5.0
23.4±4.2
<0.001
Waist-Hip Ratio
0.92±0.06
0.84±0.05
<0.001
Soft Lean Mass (SLM) (kg)
50±7
55±6
0.043
Fat Mass (kg)
28±5
23±4
0.030
Table 2.
Logistic regression coefficients for InBody, AI-derived, and combined models with adjustments for age and BMI
Variable
Adjusted Odds Ratio
95% CI
p-value
Body Fat (%)
2.10
1.70-2.65
< 0.001
Waist-Hip Ratio
2.85
2.30-3.50
< 0.001
Visceral Fat (cm³)
1.45
1.10-1.95
0.01
Subcutaneous Fat (cm³)
0.90
0.75-1.10
0.12
References
1. Abasi S, Aggas JR, Garayar-Leyva GG, Walther BK, Guiseppi-Elie A. Bioelectrical Impedance Spectroscopy for Monitoring Mammalian Cells and Tissues under Different Frequency Domains: A Review. ACS Meas Sci Au 2022;2:495-516.
3. Brewer GJ, Blue MNM, Hirsch KR, Saylor HE, Gould LM, Nelson AG, et al. Validation of InBody 770 bioelectrical impedance analysis compared to a four-compartment model criterion in young adults. Clin Physiol Funct Imaging 2021;41:317-25.
4. Chae S, Kwon J, Ko S. Relationship Between Low Back Pain and the Size and Density of the Erector Spinae Muscle and Multifidus Muscle Using CT Imaging in a Selected Community-Based Population. J Korean Soc Spine Surg 2017;24:162-8.
5. Chait A, den Hartigh LJ. Adipose Tissue Distribution, Inflammation and Its Metabolic Consequences, Including Diabetes and Cardiovascular Disease. Frontiers in Cardiovascular Medicine 7:2020.
6. Dai J, Liu T, Torigian DA, Tong Y, Han S, Nie P, et al. GANet: A geographical attention neural network for the segmentation of body torso tissue composition. Medical Image Analysis 2024;91:102987.
7. Elhakim T, Trinh K, Mansur A, Bridge C, Daye D. Role of Machine Learning-Based CT Body Composition in Risk Prediction and Prognostication: Current State and Future Directions. Diagnostics 2023;13:968.
8. Elhakim T, Trinh K, Mansur A, Bridge C, Daye D. Role of Machine Learning-Based CT Body Composition in Risk Prediction and Prognostication: Current State and Future Directions. Diagnostics (Basel) 13:2023.
9. Greco F, Mallio CA. Artificial intelligence and abdominal adipose tissue analysis: a literature review. Quantitative Imaging in Medicine and Surgery 2021;11:4461-74.
13. Jang H-Y, Choi H-J, Lee K-B, Cho S-B, Im IJ, Kim HJ. The Association between Muscle Mass Deficits Estimated from Bioelectrical Impedance Analysis and Lumbar Spine Bone Mineral Density in Korean Adults. Jbm 2016;23:95-100.
14. Jha BK, Sherpa ML, Imran M, Mohammed Y, Jha LA, Paudel KR, et al. Progress in Understanding Metabolic Syndrome and Knowledge of Its Complex Pathophysiology. Diabetology 20234;134-59.
15. Kalanjiyam GP, Chandramohan T, Raman M, Kalyanasundaram H. Artificial intelligence: a new cutting-edge tool in spine surgery. Asian Spine J 2024;18:458-71.
17. Lopez-Lopez JP, Cohen DD, Ney-Salazar D, Martinez D, Otero J, Gomez-Arbelaez D, et al. The prediction of Metabolic Syndrome alterations is improved by combining waist circumference and handgrip strength measurements compared to either alone. Cardiovascular Diabetology 2021;20:68.
18. Mai DVC, Drami I, Pring ET, Gould LE, Lung P, Popuri K, et al. A systematic review of automated segmentation of 3D computed-tomography scans for volumetric body composition analysis. J Cachexia Sarcopenia Muscle 2023;14:1973-86.
19. Mizutani M, Eguchi Y, Toyoguchi T, Orita S, Inage K, Shiga Y, et al. Association between Osteoporosis and Skeletal Muscle Mass in Men. Asian Spine J 2024;18:73-8.
20. Moy FM, Bulgiba A. The modified NCEP ATP III criteria maybe better than the IDF criteria in diagnosing Metabolic Syndrome among Malays in Kuala Lumpur. BMC Public Health 2010;10:678.
22. Neeland IJ, Ayers CR, Rohatgi AK, Turer AT, Berry JD, Das SR, et al. Associations of visceral and abdominal subcutaneous adipose tissue with markers of cardiac and metabolic risk in obese adults. Obesity (Silver Spring) 201321;E439-47.
23. Nickerson BS, Tinsley GM. Utilization of BIA-Derived Bone Mineral Estimates Exerts Minimal Impact on Body Fat Estimates via Multicompartment Models in Physically Active Adults. J Clin Densitom 2018;21:541-9.
29. Taghanaki SA, Zheng Y, Kevin Zhou S, Georgescu B, Sharma P, Xu D, et al. Combo loss: Handling input and output imbalance in multi-organ segmentation. Computerized Medical Imaging and Graphics 2019;75:24-33.
30. Tang Y, Gao R, Lee HH, Han S, Chen Y, Gao D, et al. High-resolution 3D abdominal segmentation with random patch network fusion. Med Image Anal 2021;69:101894.
31. Vu MH, Grimbergen G, Nyholm T, Löfstedt T. Evaluation of multislice inputs to convolutional neural networks for medical image segmentation. Medical Physics 202047;6216-31.
32. Wang Z, Chen J, Zhu L, Jiao S, Chen Y, Sun Y. Metabolic disorders and risk of cardiovascular diseases: a two-sample mendelian randomization study. BMC Cardiovasc Disord 2023;23:529.
33. Yushkevich PA, Piven J, Hazlett HC, Smith RG, Ho S, Gee JC, et al. User-guided 3D active contour segmentation of anatomical structures: Significantly improved efficiency and reliability. NeuroImage 2006;31:1116-28.
The Combination of AI-driven Abdominal CT and Inbody Analysis Plays a Complementary Role in Predicting Metabolic Syndrome
Fig. 1. Receiver operating characteristic (ROC) curves for AI-derived, InBody, and combined models. (A) AI-derived model: The ROC curve illustrates the predictive performance of the AI-based model using CT-derived features, achieving an area under the curve (AUC) of 0.64. (B) InBody model with an AUC of 0.82. (C) Combined model with the highest AUC of 0.83.
Fig. 1.
The Combination of AI-driven Abdominal CT and Inbody Analysis Plays a Complementary Role in Predicting Metabolic Syndrome
Metric Types
Variables
Group with MS (N=307)
Group without MS (n=670)
p-value
Patient Characteristics
Age (years)
52.1±8.3
45.6±7.5
<0.001
Sex (Male, %)
60%
45%
0.045
BMI (kg/m²)
29.3±3.5
24.8±2.7
<0.001
AI-Derived Metrics
Skeletal Muscle (SM) (cm³)
2,700±400
3,000±380
0.015
Psoas Muscle (PM) (cm³)
320±50
340±40
0.032
Extensor Spinalis Muscle (ESM) (cm³)
800±100
900±90
0.040
Multifidus Muscle (MFM) (cm³)
600±70
700±80
0.027
Subcutaneous Fat (SAT) (cm³)
240.4±60.1
320.1±70.3
<0.001
Visceral Fat (VAT) (cm³)
155.3±45.2
102.1±30.8
<0.001
InBody-Derived Metrics
Body Fat (%)
35.5±5.0
23.4±4.2
<0.001
Waist-Hip Ratio
0.92±0.06
0.84±0.05
<0.001
Soft Lean Mass (SLM) (kg)
50±7
55±6
0.043
Fat Mass (kg)
28±5
23±4
0.030
Variable
Adjusted Odds Ratio
95% CI
p-value
Body Fat (%)
2.10
1.70-2.65
< 0.001
Waist-Hip Ratio
2.85
2.30-3.50
< 0.001
Visceral Fat (cm³)
1.45
1.10-1.95
0.01
Subcutaneous Fat (cm³)
0.90
0.75-1.10
0.12
Table 1. Baseline characteristics of participants with and without metabolic syndrome. P-values for continuous variables were calculated using an independent t-test, while proportions, such as sex distribution, were analyzed using the chi-square test. MS is the abbreviation for metabolic syndrome
Table 2. Logistic regression coefficients for InBody, AI-derived, and combined models with adjustments for age and BMI