1)Department of Orthopaedic Surgery, Catholic Kwandong University College of Medicine, International St. Mary’s Hospital, Incheon, Korea
2)College of Medicine, Catholic Kwandong Graduate School, Gangneung, Korea
3)Walk101 Co., Ltd., Incheon, Korea
Corresponding author: Dong-Sik Chae, M.D., Ph.D. Department of Orthopedic Surgery, Catholic Kwandong University College of Medicine, International St. Mary’s Hospital, 25, Simgok-ro 100beon-gil, Seogu, Incheon, 22711, Korea TEL: +82-32-290-3878, FAX: +82-32-290-3879 E-mail: drchaeos@gmail.com
This is an open access article distributed under the terms of the Creative Commons Attribution Non-Commercial License (http://creativecommons.org/licenses/by-nc/4.0/) which permits unrestricted non-commercial use, distribution, and reproduction in any medium, provided the original work is properly cited.
To develop and validate a deep learning–based artificial intelligence (AI) model for automated measurement of lumbar lordosis (LL) angles from whole spine lateral radiographs.
Materials and Methods
A total of 888 lateral spine X-rays (2019–2021) were retrospectively collected and annotated with four anatomical keypoints (L1 and S1 vertebral landmarks). An AI model using Detectron2 with a Keypoint R-CNN and ResNeXt-101 backbone was trained with data augmentation. Performance was evaluated on 50 test images, comparing AI results to manual annotations by two orthopedic surgeons using intraclass correlation coefficient (ICC), Pearson’s correlation, and Bland–Altman analysis.
Results
The model achieved an average precision of 71.63 for bounding boxes and 86.61 for keypoints. ICCs between AI and human raters ranged from 0.918 to 0.962. Pearson correlation coefficients were r=0.849 and r=0.903. Bland–Altman analysis showed minor underestimation biases (–3.42° and –4.28°) with acceptable agreement.
Conclusions
The AI model showed excellent agreement with expert measurements and high reliability in LL angle assessment. Despite a slight underestimation, it offers a scalable, consistent tool for clinical use. Further studies should evaluate generalizability and interpretability in broader settings.
척추 전장 측면 엑스레이 영상에서 요추 전만각(Lumbar Lordosis, LL)을 자동으로 측정하기 위한 딥러닝 기반 인공지능(AI) 모델을 개발하고 이를 검증하고자 하였다.
대상 및 방법
2019년부터 2021년까지 획득된 측면 척추 엑스레이 영상 888장을 후향적으로 수집하고, L1과 S1 척추의 해부학적 주요 지점 네 곳을 수동으로 주석 처리하였다. Detectron2 프레임워크를 기반으로 Keypoint R-CNN과 ResNeXt-101 백본(backbone)을 사용한 AI 모델을 개발하였으며, 학습 시 데이터 증강 기법을 적용하였다. 성능 평가는 50장의 테스트 이미지에 대해 AI 결과와 두 명의 정형외과 전문의가 측정한 수동 주석값을 비교하여 수행하였고, 비교 방법으로는 평균 상관 계수(ICC), 피어슨 상관 계수(Pearson̓s correlation), Bland-Altman 분석을 사용하였다.
결과
본 모델은 바운딩 박스 평균 정밀도 71.63, 키포인트 평균 정밀도 86.61을 기록하였다. AI와 전문가 간의 ICC는 0.918~0.962로 높게 나타났고, 피어슨 상관 계수는 각각 r=0.849, r=0.903이었다. Bland-Altman 분석에서는 -3.42° 및 -4.28°의 경미한 과소 추정 바이어스를 보였으나, 전반적인 일치도는 수용 가능한 수준이었다.
결론
본 연구의 AI 모델은 요추 전만각 측정에서 전문가의 측정과 높은 일치도를 보여 신뢰성이 뛰어남을 확인하였다. 다소의 과소 추정 경향이 있으나, 임상적으로 확장 가능하고 일관된 자동 측정 도구로 활용될 수 있다. 향후 연구에서는 다양한 환경에서의 일반화 가능성과 모델 해석 가능성에 대한 추가 평가가 필요하다.
Lumbar lordosis (LL), the inward curvature of the lower spine, is a key anatomical feature that contributes to proper posture, weight distribution, and spinal balance. Deviations from the normal curvature—either hyperlordosis or hypolordosis—are closely associated with various spinal pathologies such as chronic low back pain, degenerative disc disease, and sagittal imbalance.1-4) Accurate and consistent measurement of LL is thus critical for both diagnostic and therapeutic decision-making in clinical practice. Traditionally, clinicians manually measured the lordotic angle on lateral spinal radiographs, which can be time-intensive and subject to inter- and intra-observer variability.5)
Recent developments in artificial intelligence (AI), particularly in deep learning and convolutional neural networks (CNNs), have significantly advanced the field of medical image analysis. AI-based models have shown high accuracy in detecting anatomical landmarks, segmenting spinal structures, and even classifying pathological conditions in radiographic images.6) In this study, we present a deep learning-based AI model specifically designed to measure LL angles automatically from whole spine lateral radiographs. By leveraging annotated datasets and robust model architectures, our approach aims to improve measurement consistency, reduce clinician workload, and enable scalable spinal angle measurements in both clinical and research settings.
Materials and Methods
1. Data Collection
This study was conducted with approval from the Institutional Review Board (IRB) of the Catholic Kwandong University International St. Mary’s Hospital (IS20RISI0015). A total of 2,397 X-ray images were retrospectively collected from the hospital’s Picture Archiving and Communication System (PACS) from 2019 to 2021. Among them, 888 high-quality images were selected based on the following inclusion criteria: absence of image noise and clear visualization of skeletal structures.
The dataset was divided into training, validation, and test sets, with the gender distribution balanced as closely as possible to a 1:1 ratio across all sets. All data were anonymized before use in research, with all personally identifiable information removed.
2. Annotation
Annotation guidelines were developed by an orthopedic surgeon with over 10 years of clinical experience. The actual labeling was carried out by a registered nurse with more than 5 years of clinical experience, following training based on the aforementioned guidelines and conducted under the supervision of the orthopedic surgeon.
A total of four anatomical keypoints were defined: the superior-anterior and superior-posterior positions of the L1 and S1 vertebral bodies. Bounding boxes were annotated to include major skeletal structures such as the sacrum and femoral heads. All annotations were created using the COCO-annotator tool, and 50% of the annotations were reviewed by the orthopedic surgeon to ensure labeling accuracy. Final labels were saved in COCO format (JSON).
3. AI Model Training
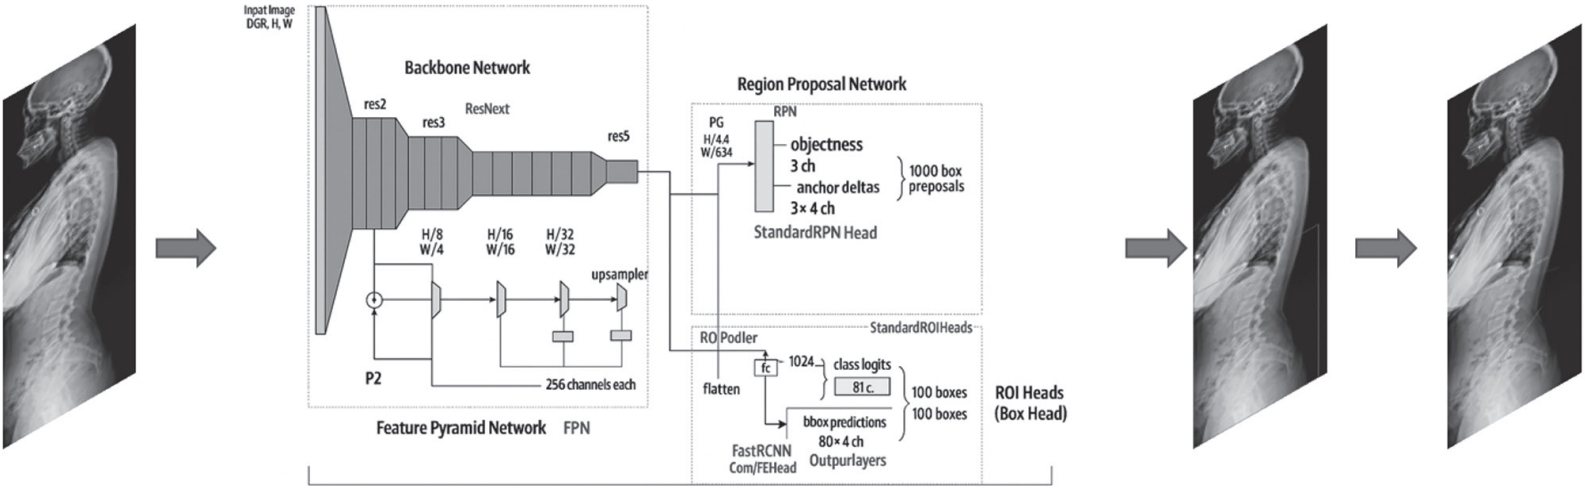
We utilized the Detectron2 framework developed by Facebook AI Research, specifically employing the Keypoint RCNN with Feature Pyramid Network (FPN) architecture. The backbone network was ResNeXt-101 (32×8d), initialized with pre-trained ImageNet weights (X-101-32x8d.pkl). Training was conducted for a total of 30,000 iterations. The learning rate was scheduled to decay at 15,000 and 25,000 iterations. Stochastic Gradient Descent (SGD) was used as the optimizer, following the default configuration in Detectron.2) The model configuration was based on the “Base- Keypoint-RCNN-FPN.yaml” file with custom modifications to specific parameters. Input image size was fixed at 1024 pixels. To enhance generalization and increase dataset diversity, various data augmentation techniques such as random rotation, brightness adjustment, and saturation modification were applied. The architecture of the final model is presented in Fig. 1. The experiments were conducted on a workstation equipped with Ubuntu 22.04, an AMD Ryzen Threadripper PRO 965WX CPU (24 cores, 48 threads), 256 GB RAM, and dual NVIDIA GeForce RTX 4090 GPUs.
4. Testing
A test set was composed of whole spine lateral X-rays from 50 separate patients who were not included in the training or validation datasets. Two orthopedic surgeons with over 10 years of clinical experience—orthopedic surgeon 1 (S.-B. L.) and orthopedic surgeon 2 (D.-S. C.)—independently annotated the LL keypoints on these images. The LL values measured from these annotations were compared and analyzed against those measured by the AI model.
5. Statistical Analysis
Intraclass correlation coefficient (ICC) was calculated to assess the reliability and agreement between measurements obtained by different raters and the AI model. The strength of correlation between the measurements was evaluated using Pearson’s correlation coefficient. Additionally, Bland- Altman analysis was performed to assess the agreement and systematic bias between the AI model and human raters, as well as to identify the limits of agreement. All statistical analyses were conducted using the latest version of IBM SPSS Statistics (version 29), and a p-value of less than 0.05 was considered statistically significant.
Results
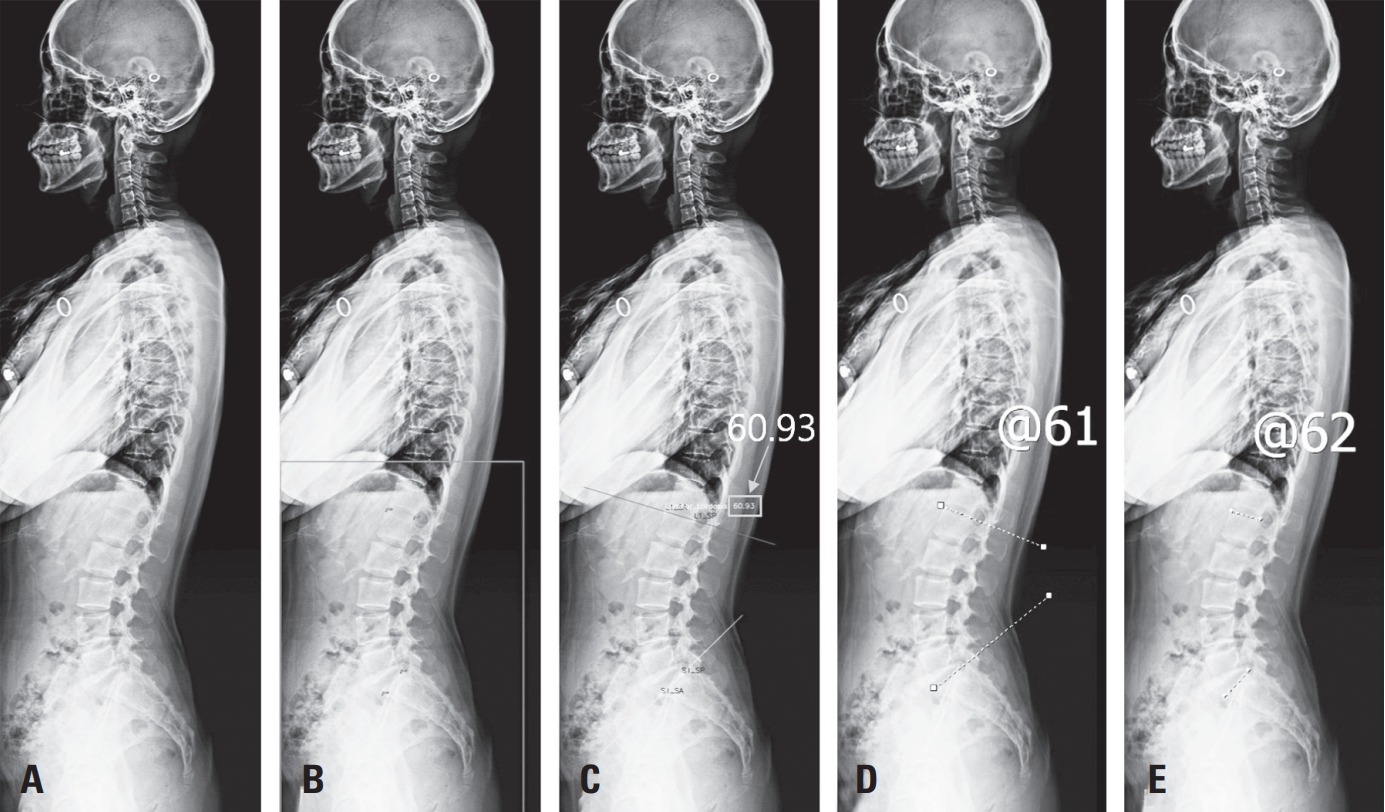
The training set consisted of whole-spine lateral X-ray images from 740 individuals. The validation set included images from 98 individuals, and the test set comprised 50 individuals (Table 1). Representative images comparing angle measurements between the AI and orthopedic surgeons 1 and 2 are shown in Fig. 2.
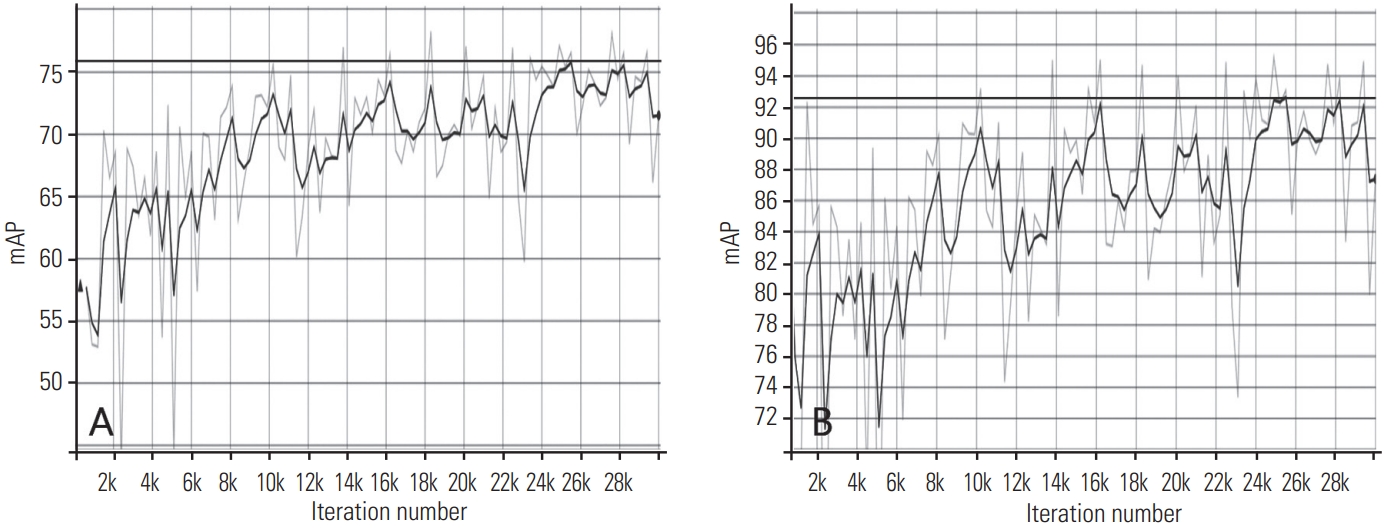
The model’s performance was evaluated using 50 images from the test dataset. The mean Average Precision (mAP) was measured for both bounding boxes and keypoints. (A) represents the mAP for bounding boxes, with a best score of 75.78. (B) shows the keypoint mAP, calculated based on Object Keypoint Similarity (OKS), achieving a best mAP of 92.63 (Fig. 3).
The ICC between orthopedic surgeon 1 and the AI model was 0.918, and between orthopedic surgeon 2 and the AI model was 0.949. When comparing all three—orthopedic surgeon 1, orthopedic surgeon 2, and the AI model—the ICC was 0.962.
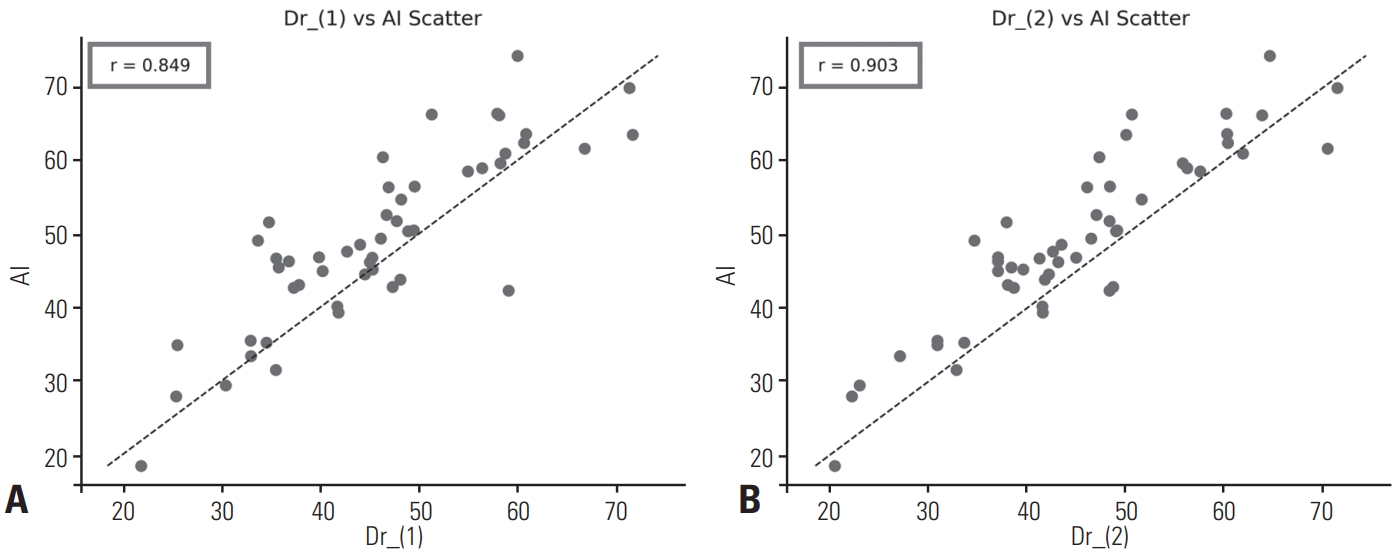
Correlation analysis revealed a strong positive correlation between the AI model and orthopedic surgeon 1, with a Pearson correlation coefficient of r=0.849. Similarly, a high degree of agreement was observed between the AI model and orthopedic surgeon 2, with r=0.903. In both scatterplots, data points were clustered near the identity line (y=x) (Fig. 4).
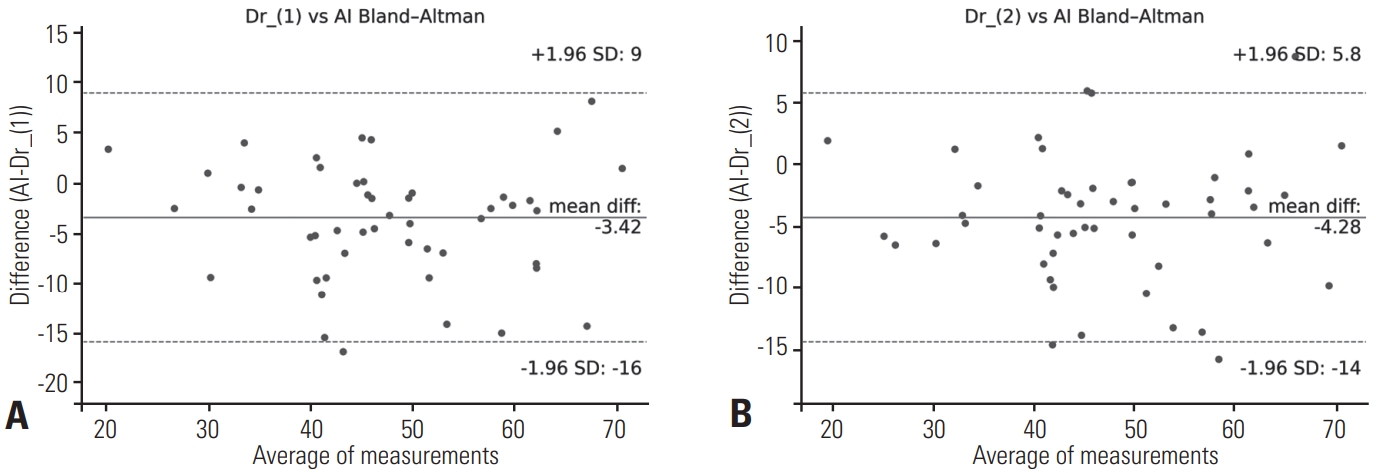
The Bland-Altman analysis demonstrated that, compared to orthopedic surgeon 1, the AI exhibited a mean bias of –3.42°, with 95% limits of agreement ranging from –16° to +9°. In comparison to orthopedic surgeon 2, the AI showed a mean bias of –4.28°, with 95% limits of agreement from –14° to +5.8° (Fig. 5).
Discussion
In this study, we developed and validated an AI-based model for automatic measurement of LL from lateral spinal radiographs. Our model demonstrated high agreement with expert manual measurements, aligning with existing literature on AI applications in spinal alignment analysis. Given the clinical importance of LL in assessing spinal biomechanics and guiding surgical planning, the ability to automate this measurement with precision presents significant value, particularly in high-volume clinical settings where efficiency and consistency are critical. Furthermore, integration with PACS in clinical practice would enable the provision of immediate visual data to patients and facilitate the explanation of their spinal health conditions.
Previous studies have demonstrated the feasibility of using AI models to estimate a variety of spinal and pelvic parameters. For example, Harake et al.7) proposed Spine- Pose, a deep learning model trained on over 700 lateral radiographs, capable of simultaneously estimating LL, pelvic incidence (PI), sacral slope (SS), and pelvic tilt (PT). Their model achieved ICCs of 0.91 to 1.00, suggesting excellent reliability across multiple parameters. In addition, a study by Löchel et al.8) employed a deep learning algorithm on adult spinal deformity patients to measure sagittal alignment parameters, reporting ICCs between 0.71 and 0.99 across LL, PI, SS, and PT, including postoperative radiographs. This highlights the clinical robustness of AI models even under the variable anatomical presentations found in deformity or post-surgical populations. A recent meta-analysis further consolidates the reliability of AI models in spinopelvic measurement, reporting pooled mean absolute errors of 3.6° for LL, 4.1° for PI, and 1.9° for PT, with ICCs consistently above 0.80.9) These findings are consistent with the performance of our model and suggest that AI-based measurements can reach or even surpass human-level consistency, particularly in standardized imaging conditions.
The results of our study demonstrate that the AI model achieves excellent agreement with human raters in measuring LL, as evidenced by ICCs exceeding 0.90 across all comparisons—between orthopedic surgeon 1 and the AI, orthopedic surgeon 2 and the AI, and the combined orthopedic surgeons and the AI—according to the classification criteria proposed by Fleiss10) and Cicchetti & Sparrow.11) Additionally, Pearson correlation coefficients revealed strong positive linear relationships (r=0.849 and r=0.903 for orthopedic surgeon 1 and 2, respectively), with data points closely aligned along the identity line, indicating that the AI closely replicates the measurement tendencies of human experts. However, Bland–Altman analysis revealed a slight systematic underestimation bias by the AI of approximately 3–4°, with limits of agreement extending up to –16°, suggesting that although the model exhibits strong overall concordance, further calibration and validation are warranted to minimize potential outliers and enhance clinical reliability.
Several limitations should be acknowledged. First, the generalizability of AI models remains limited by the composition of the training dataset. Factors such as imaging modality, patient positioning, skeletal maturity, and pathology-specific variation may affect performance. Additionally, while current AI models perform well in detecting pre-defined anatomical landmarks, their interpretability remains limited, which may pose challenges in clinical integration and medico-legal contexts. Importantly, the systematic underestimation of 3–4° by the AI model is not negligible for surgical planning, as even small deviations in lumbar lordosis angle can influence decisions regarding corrective procedures. The authors should further discuss the clinical implications of this measurement bias, particularly in contexts requiring precise angle restoration. To address these limitations, future work should focus on building a more diverse and expansive multicenter dataset that includes various anatomical and pathological presentations. Moreover, exploring and training more advanced model architectures with improved capacity to capture complex anatomical variations may help reduce bias and enhance accuracy. In parallel, developing interpretable AI frameworks that can provide not only predictions but also uncertainty estimates and visual rationales will be essential for reliable clinical integration.
In conclusion, our findings contribute to the growing evidence that AI can reliably and efficiently measure spinal alignment parameters, including LL. Integration of these models into clinical workflows has the potential to reduce interobserver variability, streamline diagnostic processes, and facilitate large-scale spinal screening or surgical planning. Continued validation in heterogeneous clinical populations and real-world environments is essential to fully realize the potential of AI-assisted spinal analytics.
NOTES
Acknowledgements
This work was supported by the National Research Foundation of Korea (NRF) grant funded by the Korea government (MSIT) (RS-2023-00239313). Also, this research was supported by a grant from the Korea Health Technology R&D Project through the Korea Health Industry Development Institute (KHIDI), funded by the Ministry of Health & Welfare, Republic of Korea (RS-2023-KH142586).
Fig. 1.
Overview of the Detectron2 architecture. It consists of a backbone network (e.g., ResNeXt), a feature pyramid network (FPN) for multi-scale feature extraction, and keypoint detection heads tailored for X-ray image analysis.
Fig. 2.
Representative whole-spine lateral X-ray images for lumbar lordosis angle measurement comparison. (A) Original X-ray image. (B) AIpredicted spinal contour. (C) Angle measurement lines based on AI-detected keypoints. (D) Angle measured manually by orthopedic surgeon 1. (E) Angle measured manually by orthopedic surgeon 2.
Fig. 3.
Mean Average Precision (mAP) for both bounding boxes and keypoints. (A) The mAP for bounding boxes achieved a best score of 75.78. (B) The keypoint mAP, calculated based on Object Keypoint Similarity (OKS), achieved a best score of 92.63.
Fig. 4.
Scatterplots comparing AI-inferred and manually measured lumbar lordosis angles. (A) AI vs. Orthopedic surgeon 1 (identity line: y=x; r=0.849, p<0.001). (B) AI vs. Orthopedic surgeon 2 (identity line: y=x; r=0.903, p<0.001).
Fig. 5.
Bland–Altman plots comparing AI-inferred and manually measured lumbar lordosis angles. (A) AI vs. Orthopedic surgeon 1 (mean bias: –3.42°; 95% limits of agreement: –16° to +9°). (B) AI vs. Orthopedic surgeon 2 (mean bias: –4.28°; 95% limits of agreement: –14° to +5.8°).
Table 1.
Datasets and patient demographics
Training set
Validation set
Test set
X-ray images, n
740
98
50
Age, mean±SD years (range)
48.24±25.36 (3–89)
48.11±25.76 (7–83)
48.7±24.78 (8–86)
Sex ratio, male:female
0.488:0.512
0.459:0.541
0.440:0.560
SD: standard deviation.
References
1. Barrey C, Jund J, Noseda O, Roussouly P. Sagittal balance of the pelvis-spine complex and lumbar degenerative diseases. A comparative study about 85 cases. Eur Spine J 2007;16(9):1459-67. doi:10.1007/s00586-006-0294-6.
2. Le Huec JC, Thompson W, Mohsinaly Y, Barrey C, Faundez A. Sagittal balance of the spine. Eur Spine J 2019;28(9):1889-905. doi:10.1007/s00586-019-06083-1.
3. Kim WJ, Ma CH, Kim SH, et al. Prevention of Adjacent Segmental Disease after Fusion in Degenerative Spinal Disorder: Correlation between Segmental Lumbar Lordosis Ratio and Pelvic Incidence–Lumbar Lordosis Mismatch for a Minimum 5-Year Follow-up. Asian Spine J 2019;13(4):654-62. doi:10.31616/asj.2018.0279.
4. Beng TB, Kotani Y, Sia U, Gonchar I. Effect of Indirect Neural Decompression with Oblique Lateral Interbody Fusion Was Influenced by Preoperative Lumbar Lordosis in Adult Spinal Deformity Surgery. Asian Spine J 2019;13(5):809-14. doi:10.31616/asj.2018.0283.
5. Vrtovec T, Pernuš F, Likar B. A review of methods for quantitative evaluation of spinal curvature. Eur Spine J 2009;18(5):593-607. doi:10.1007/s00586-009-0913-0.
6. Litjens G, Kooi T, Bejnordi BE, et al. A survey on deep learning in medical image analysis. Medical Image Analysis 2017;42:60-88. doi:10.1016/j.media.2017.07.005.
7. Harake ES, Linzey JR, Jiang C, et al. Development and validation of an artificial intelligence model to accurately predict spinopelvic parameters. J Neurosurg Spine 2024;41(1):88-96. doi:10.3171/2024.1.SPINE231252.
8. Löchel J, Putzier M, Dreischarf M, et al. Deep learning algorithm for fully automated measurement of sagittal balance in adult spinal deformity. Eur Spine J 2024;33(11):4119-24. doi:10.1007/s00586-023-08109-1.
9. Glaser D, AlMekkawi AK, Caruso JP, et al. Deep learning for automated spinopelvic parameter measurement from radiographs: a meta-analysis. ais 2025;5(1):1-15. doi:10.20517/ais.2024.36.
10. Fleiss JL. Statistical Methods for Rates and Proportions. Wiley-Interscience; 1981.
11. Cicchetti DV, Sparrow SA. Developing criteria for establishing interrater reliability of specific items: Applications to assessment of adaptive behavior. Am J Ment Defic 1981;86(2):127-37.
Deep Learning–based AI Analysis of the Correlation Between Lumbar Lordosis and Age Soo-Bin Lee, Ja-Yeong Yoon, Dong-Sik Chae, Sang-Bum Kim, Young-Seo Park, Kyung-Yil Kang, Min-Kyu Lee Journal of Advanced Spine Surgery.2025; 15(2): 78. CrossRef
Efficacy of Biportal Endoscopic Decompression for Lumbar Spinal Stenosis: A Meta-Analysis With Single-Arm Analysis and Comparative Analysis With Microscopic Decompression and Uniportal Endoscopic Decompression Shuangwen Lv, Haiwen Lv, Yupeng He, Xiansheng Xia Operative Neurosurgery.2024; 27(2): 158. CrossRef
Measurement of Lumbar Lordosis Using a Deep Learning-Based Artificial Intelligence Model
Fig. 1. Overview of the Detectron2 architecture. It consists of a backbone network (e.g., ResNeXt), a feature pyramid network (FPN) for multi-scale feature extraction, and keypoint detection heads tailored for X-ray image analysis.
Fig. 2. Representative whole-spine lateral X-ray images for lumbar lordosis angle measurement comparison. (A) Original X-ray image. (B) AIpredicted spinal contour. (C) Angle measurement lines based on AI-detected keypoints. (D) Angle measured manually by orthopedic surgeon 1. (E) Angle measured manually by orthopedic surgeon 2.
Fig. 3. Mean Average Precision (mAP) for both bounding boxes and keypoints. (A) The mAP for bounding boxes achieved a best score of 75.78. (B) The keypoint mAP, calculated based on Object Keypoint Similarity (OKS), achieved a best score of 92.63.
Fig. 4. Scatterplots comparing AI-inferred and manually measured lumbar lordosis angles. (A) AI vs. Orthopedic surgeon 1 (identity line: y=x; r=0.849, p<0.001). (B) AI vs. Orthopedic surgeon 2 (identity line: y=x; r=0.903, p<0.001).
Fig. 5. Bland–Altman plots comparing AI-inferred and manually measured lumbar lordosis angles. (A) AI vs. Orthopedic surgeon 1 (mean bias: –3.42°; 95% limits of agreement: –16° to +9°). (B) AI vs. Orthopedic surgeon 2 (mean bias: –4.28°; 95% limits of agreement: –14° to +5.8°).
Fig. 1.
Fig. 2.
Fig. 3.
Fig. 4.
Fig. 5.
Measurement of Lumbar Lordosis Using a Deep Learning-Based Artificial Intelligence Model