Department of Orthopaedic Surgery, Ajou University School of Medicine, Suwon, Korea
Corresponding author: Han-Dong Lee, M.D. Department of Orthopaedic Surgery, Ajou University School of Medicine 164, World Cup rd, Yeongtong-gu, Suwon, 16499, Korea TEL: +82-31-219-5220, FAX: +82-31-219-5229 E-mail: handonglee@gmail.com
This is an open access article distributed under the terms of the Creative Commons Attribution Non-Commercial License (http://creativecommons.org/licenses/by-nc/4.0/) which permits unrestricted non-commercial use, distribution, and reproduction in any medium, provided the original work is properly cited.
Neurogenic bladder dysfunction is a common and serious consequence of traumatic conus medullaris syndrome (T-CMS). Despite its clinical importance, predictive data for bladder outcomes after T-CMS remain limited. This study aimed to identify predictors of neurogenic bladder dysfunction at ≥2 years post-injury.
Methods
We retrospectively reviewed 39 patients with acute T-CMS treated at a single level I trauma center from 2004–2017 who underwent spinal surgery and had ≥2 years of follow-up. Bladder function at 2 years was categorized as complete dysfunction, incomplete dysfunction, or normal. Potential predictors included demographic factors, injury mechanisms, ASIA Impairment Scale grades, MRI timing, fracture level and type, canal diameter, occupying ratio, conus signal change (normal, edema, or edema with hemorrhage), edema length, time to surgery, and surgical approach. Univariate and multivariate analyses were performed.
Results
At final follow-up, 14 patients (35.9%) had complete bladder dysfunction, 12 (30.8%) had incomplete dysfunction, and 13 (33.3%) had normal function. Multivariate analysis identified edema with hemorrhage in the conus medullaris as the only independent predictor of bladder dysfunction.
Conclusions
Bladder dysfunction is highly prevalent after T-CMS. Hemorrhagic edema in the conus medullaris significantly increases the risk of long-term neurogenic bladder dysfunction.
신경인성 방광 기능 장애는 외상성 원추부 척수 증후군(traumatic conus medullaris syndrome, T-CMS)에서 흔하면서도 심각한 합병증이다. 임상적으로 중요한 문제임에도 불구하고, T-CMS 이후 장기적인 방광 기능 예후를 예측할 수 있는 자료는 아직 제한적이다. 본 연구의 목적은 손상 후 2년 이상 경과 시점에서 신경인성 방광 기능 장애를 예측할 수 있는 인자를 규명하는 데 있다.
방법
2004년부터 2017년까지 단일 레벨 I 외상센터에서 급성 T-CMS로 진단되어 척추 수술을 시행받고, 2년 이상 추적 관찰이 가능했던 39명의 환자를 대상으로 후향적 분석을 시행하였다. 손상 후 2년 시점의 방광 기능은 완전 기능 장애, 불완전 기능 장애, 정상 기능의 세 군으로 분류하였다. 예측 인자로는 인구학적 요인, 손상 기전, ASIA 손상 등급, MRI 촬영 시점, 골절의 레벨 및 형태, 척추관 직경, 점유율(occupying ratio), 원추부 척수 신호 변화(정상, 부종, 출혈을 동반한 부종), 부종의 길이, 수술까지의 시간, 수술 접근법 등을 포함하였다. 단변량 및 다변량 분석을 시행하였다.
결과
최종 추적 관찰 시점에서 14명(35.9%)은 완전 방광 기능 장애, 12명(30.8%)은 불완전 방광 기능 장애, 13명(33.3%)은 정상 방광 기능을 보였다. 다변량 분석 결과, 원추부 척수에서 출혈을 동반한 부종이 장기적인 방광 기능 장애를 예측하는 유일한 독립적 위험 인자로 확인되었다.
결론
외상성 원추부 척수 증후군 이후 방광 기능 장애는 매우 높은 빈도로 발생한다. 특히 원추부 척수의 출혈성 부종은 장기적인 신경인성 방광 기능 장애의 위험을 유의하게 증가시키는 중요한 예측 인자이다.
The conus medullaris (CM) is the finely tapered distal end of the spinal cord and contains both the sacral and coccygeal spinal segments.1,2) The CM had a variable location between T12 and L-23. The CM syndrome (CMS) results when there is compressive damage to the spinal cord from T12-L2.4) The clinical symptoms of CMS include the low back pain, lower limb weakness, perineum or saddle anesthesia, and bowel and/or bladder dysfunction.3,4) The CM is susceptible to injury because of its proximity to the frequently injured thoracolumbar junction.5) Therefore, traumatic CMS (T-CMS) is not rare. Harrop et al6) reviewed 282 spinal cord injury (SCI) patients and demonstrated approximately a quarter of spinal cord injury (SCI) patients were T-CMS patients. A neurological deficit is present in approximately 4 to 42% of patients with thoracolumbar junction fractures.3)
Neurogenic bladder dysfunction represents one of the most common and devastating sequelae of T-CMS.1,5,7) It might lead to complications such as recurrent urinary tract infections, urethral strictures, calculus disease, hydronephrosis, and renal failure.8) Early diagnosis and treatment of neurogenic bladder dysfunction is essential to prevent irre-versible deterioration of urinary tract function and potential life threatening complications. Early prediction of bladder function recovery would play a key role to orient a patienttailored rehabilitative program and to counsel patients and their families. However, there has been no literatures predicting long-term bladder dysfunction in T-CMS.
Magnetic resonance image (MRI) is currently the gold standard for imaging of spinal cord injury (SCI) for predicting neurological outcome.9,10) Since 1986, it has been found that the presence of spinal cord edema and hemorrhage is associated with a worse neurological outcome.10-14) Spinal cord edema manifest as T2 intramedullary hyperintensity and known to be related with reduced motor recovery.12,13,15) Spinal cord hemorrhage manifest as T2 intramedullary hypointensity and is associated with an irreversible neurological deficit and is one of the most important predictors for neurological outcome.12,13,15,16) CM is the caudal end of spinal cord and the relationship between signal changes in spinal cord and neurological prognosis in SCI patients can be applied to T-CMS patients. To our knowledge, there has no clinical studies analyzing the relationship between MRI signal characteristics of CM and long-term bladder outcome in T-CMS.
The aim of our study was to develop a model to predict neurogenic bladder dysfunction at minimum 2 year follow-up using clinical and radiological factors including MRI signal characteristics of CM in T-CMS patients.
Methods
1. Study population
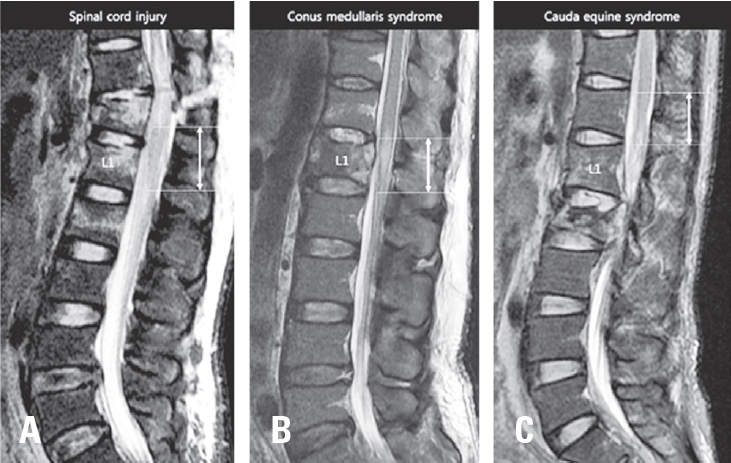
We performed retrospective cohort study evaluating 40 patients who presented to a level I trauma center between 2004 and 2017 with acute T-CMS and undergone a spinal surgical procedure. Diagnosis of T-CMS was made if all three criteria were met: (1) acute traumatic vertebral fracture in T12, L1, or L2; (2) the presence any neurologic deficit regarding CMS including leg weakness, decreased voluntary anal contraction, or sensory change in lower extremity or perianal area; (3) compression of CM or intramedullary signal change in CM on T2-weighted MRI (Fig. 1). The location of conus medullaris was confirmed on T1 and T2-weighted sagittal and axial images. Cases with compression of cauda equina (n=4) or compression or signal change in thoracic spinal cord (n=1) without involvement of CM were excluded.
Inclusion criteria were: (1) Age ≥15 years, (2) followedup more than 2 years. Exclusion criteria were (1) previous spinal disease or surgery, (2) previous bladder dysfunction, (3) penetrating injury of CM, (4) associating injury impact on bladder function such as bladder rupture or pelvic bone injury. One patient was lost during follow-up. Finally, thirty nine patients met inclusion and exclusion criteria. Clinical data including age, gender, cause of injury (high fall, low fall, motor vehicle injury, and crushed with heavy subject), American Spinal Injury Association Impairment Scale (AIS) at injury, time from injury to MRI, fracture type (burst, flexion-distraction, and fracture-dislocation), fracture level, time from injury to surgery, and surgical details, were collected.
2. Radiological analysis
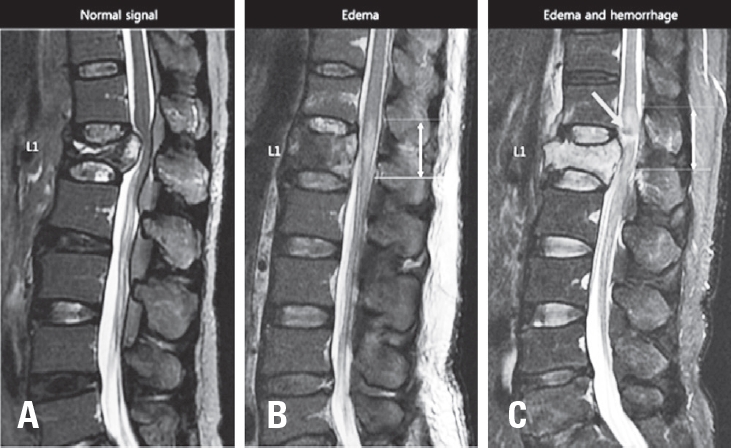
T2 weighted mid-sagittal MRI scans at acute injury were collected for each patient. MRI mid-sagittal image was defined as a sagittally oriented image in which the spinous processes were best visible. Three categories of intramedullary signal in CM were determined according to the presence of intramedullary edema or hemorrhage (Fig. 2). Type I is normal without signal change in CM. Type 2 is intramedullary edema in CM, which had intramedullary lesions of high signal intensity on T2-weighted image. Type 3 is mixed intramedullary edema and hemorrhage in CM. Intramedullary hemorrhage present with low signal intensity on T2-weighted image. Maximal vertical length of intramedullary edema in CM was measured on T2-weighted sagittal image. Maximal canal compromise at mid-sagittal image was determined by measuring anteroposterior (AP) canal diameter at the point of maximal canal compromise. Maximal AP canal encroachment ratio was calculated using AP canal diameters of fractured vertebra (DF) and one level above (DA) and below (DB) vertebra; maximal osseous canal compromise=[1-DF/{(DA+DB)/2}]×100%. All radiological measurements were done by one experienced surgeon who was blinded to neurological outcome of patients and done by picture archiving and communication system (INFINITT PACS; INFINITT, Seoul, Korea).
3. 5Grading of bladder function
We reviewed medical records at minimum 2 year follow-up to analyze long-term bladder outcome. We graded bladder dysfunction of each patient into complete (voiding using clean intermittent catheterization or indwelling catheter), incomplete (voiding using Valsalva maneuver, intermittent diaper use for intermittent incontinence, or feeling difficulty due to frequency or urgency), and normal (without any subjective difficulty of voiding urine).
4. Statistical analyses
Comparison between three bladder dysfunction groups were analyzed using kai square test and ANOVA test depending on type of variables. Univariate analysis was performed to determine the odds ratios (ORs) and 95% confidence intervals (CIs) for the relationship between independent variables and the presence of bladder dysfunction (complete and incomplete) at final assessment. Given the relatively small sample size, AIS B, C, and D were combined to maximize statistical power. For length of edema on conus medullaris, ORs were calculated on the basis of having a bladder dysfunction if edema was greater than the median value. Multivariate logistic regression analysis was used to identify independent risk factors for bladder dysfunction. Multivariate models included those with P values of <0.20 in the univariate analyses. The data from this study were analyzed using SPSS statistical software (ver. 20.0; IBM Corp., Armonk, NY, USA). In all analyses, p<0.05 was taken to indicate statistical significance.
The mean age (and standard deviation) of patients was 46.1±13.9 years, and the majority of patients were male (n=28 [71%]). High fall was the most common cause of injury (n=29 [74%]). Burst fractures (n=31 [79%]) were the most common fracture type and L1 level (n=26 [67%]) was most commonly involved level.
2. Baseline MRI characteristics
The median time to MRI following injury was 7.5 hours. Except 6 patients (15%), all MRI were taken within 24 hours of injury. Two patients were delayed due to late diagnosis and four patients were delayed due to poor condition. Majority of patients had signal changes in CM on T2-weight midsagittal MRI at injury. Nineteen patients (49%) had edema on CM and 16 patients (41%) had edema and hemorrhage on CM. Mean length of edema of CM was 24.5±16.8 mm. Mean maximal AP canal length was 6.1±2.1 mm and mean maximal AP encroachment ratio was 55.0±16.2%.
3. Surgical factors
The median time to surgery following injury was 11.9 hours. Except 6 patients (15%), all surgery were done within 72 hours of injury. Majority of surgery was done with posterior only approach (31 patients [79%]). After surgery, mean maximal AP canal length increased to 12.5±2.5 mm and mean maximal AP encroachment ratio decreased to 12.8±13.4%.
Seven patients (18%) were initially classified as AIS grade A (complete motor and sensory deficit below the level of injury). At baseline, majority of patients had incomplete motor deficit with AIS grade C (motor incomplete, less than half of key muscle functions below the level of injury have a muscle grade ≥3, 15 patients [38%]) and AIS grade D (motor incomplete, at least half of key muscle functions below the level of injury having a muscle grade ≥3, 16 patients [41%]). Twenty patients (51%) improved with at least one grade of AIS grade at final assessment. One patient (3%) deteriorated at final assessment. At final assessment, majority of patients were AIS grade D (22 patients [56%]) and AIS grade E (normal, 7 patients [18%]). Overall, there was an average improvement of 0.7 AIS grades among the study population.
At final assessment, fourteen patients (35.9%) had complete bladder dysfunction and 12 patients (31%) had incomplete dysfunction. Comparative analysis revealed significant differences of AIS grade at injury, fracture type, signal characteristics of conus medullaris, and length of edema (All p<0.05). AIS A were more frequent in complete bladder dysfunction group (43%). There was no AIS grade A patient in normal bladder group. Fracture-dislocation type fracture is more frequent in complete bladder dysfunction group than normal group (50% vs. 8%). Edema and hemorrhage type signal characteristics of conus medullaris is not present in complete and incomplete bladder dysfunction group. On the other hand, no patient had edema and hemorrhage on conus medullaris in normal bladder group. Mean length of edema on conus medullaris is longest in complete bladder group (38.3±14.7 mm) and shortest in normal bladder group (13.3±9.9 mm).
Univariate analysis identified 4 independent variables with a p-value<0.2 that were associated with a bladder dysfunction at final assessment. Fracture-dislocation type fracture, the presence of edema and hemorrhage in CM, >20 mm length of edema in CM, and time from injury to surgery were entered into a stepwise multivariate logistic regression analysis to assess the likelihood of bladder dysfunction at the initial assessment. Of these, only the presence of edema and hemorrhage in CM was identified as independently influencing the likelihood of bladder dysfunction at the initial assessment (OR, 9.4 [95% CI, 0.9 to 97.1]; p=0.04). None of other variables except the presence of edema and hemorrhage in CM had a significant association with bladder dysfunction (p>0.05).
Discussion
This study demonstrates that bladder dysfunction occur commonly following T-CMS. The presence of edema and hemorrhage in CM was significantly associated with bladder dysfunction. A number of other variables were also examined in relationship to outcome. Although some of these were significantly associated with bladder dysfunction on univariate analysis, none other than the presence of edema and hemorrhage in CM were independently associated with bladder dysfunction on multivariate analysis.
T-CMS has unique clinical characteristics and prognosis differed from SCI and cauda equina syndrome. T-CMS patients have better neurologic recovery than SCI patients.17,18) and different type of bladder dysfunction.1) CMS has more symmetrical neurologic deficit and poorer neurologic recovery than cauda equine syndrome because CMS involves upper motor neuron.4,19) Clear diagnosis of T-CMS should be premised to identify the prognosis and related factors in T-CMS. Although some literatures diagnosed T-CMS with clinical findings,20-22) most literatures diagnosed T-CMS using the level of injury.4,7,18,23-26) Brouwers et al suggested the diagnosis of T-CMS with a trauma to vertebra T12–L2 in combination with neurological impairment in dermatomyotomes Th12–S54. Our study diagnosed T-CMS using this methods. Furthermore, we analyzed MRI images and excluded pure cauda equina injury and SCI (Fig. 1).
Bladder dysfunction is the major devastating sequelae after T-CMS.1,5,7) However, the number of literatures regarding the long-term prognosis of bladder function is limited and with small number of patients. McAfee et al assessed 32 T-CMS patients (CM injury was made on the basis of the clinical findings of a neurogenic bladder, and the loss or third, fourth and fifth sacral nerve root sensation) at mean 3.4 year follow-up and found that 20 patients (62%) had bladder dysfunction at final assessment. Dall et al27) evaluated 14 T-CMS patients (T12, L1 burst fracture) at mean 32 month follow-up. Three patient (21%) had bladder dysfunction at one year follow-up. Taylor et al1 assessed bladder function of 18 T-CMS patients (with L1 or L2 burst fractures) at mean 4 year follow-up. The half of patients could not control bladder. Six patients (33%) had no bladder sensation and twelve patients (67%) had altered sensation of bladder fullness. Clohisy et al20) analyzed 11 T-CMS patients (T12, L1 fracture) who surgically treated within 48 hours of injury and five (45%) had bladder dysfunction at final follow-up. Rahimi-Movaghar et al5) evaluated bladder function of 11 T-CMS patients (T12, L1 fracture) at 8 months – 12 years follow-up. Three patients (27%) recovered partially and no improvement in 5 patients (47%). Overall, the rate of bladder dysfunction after T-CMS was approximately 21-100%. Our study evaluated 39 patients and about 64% of patients had bladder dysfunction at minimum 2 year follow-up. The reported rate of patients with bladder dysfunction 1 year after traumatic SCI ranges from 69-78%.8) Although T-CMS patients have better neurologic recovery than SCI patients,17,18) the recovery rate of bladder function in T-CMS patients may be poor as much as in SCI patients.
There have been a paucity of literature introducing the prognostic factor in T-CMS. McAfee et al22) and Bradford et al25) suggested that anterior decompression could improve bladder dysfunction. Clohisy et al20) found early decompression (within 48 hours of injury vs. mean 61 days after injury) improve bladder function. Dall et al27) demonstrate that canal compromise, fracture pattern, or treatment was not related with recovery bladder function. In current study, surgical approach and timing were not related with bladder dysfunction. However, those results may not mean that surgical approach and timing is not related with neurological outcome. Because, the small number of patients were treated with anterior approach and there were some outliers regarding surgical timing in the current study. Regarding fracture type, there were significant differences of fracture type between three bladder outcome groups in current study. However, fracture type was not the predictor of bladder dysfunction in multivariate logistic regression model as shown in the other study. Canal compromise was not related with bladder dysfunction in this study. AIS grade at injury is known to be important prognostic factor for recovery of neurologic deficit in SCI.9) In current study, AIS grade was significantly different between three bladder outcome groups. However, AIS grade at injury was not related in univariate analysis. In prediction model of bladder function in SCI patients, AIS was not indicative for recovery of bladder function.8) AIS grade may also not be related with the recovery of bladder function in T-CMS.
Signal changes in SCI are considered as the important predictor of neurologic recovery.16) Cord edema is seen on T2 MRI sequences as a hyperintensity of the signal within the cord and intramedullary hemorrhage manifests as T2 hypointensity within the cord.9,10,16,28,29) Hemorrhage is almost always present concurrently with edema, and on an MRI it is surrounded by a hyperintensity normally associated with edema. Intramedullary hemorrhage on T2W imaging is universally associated with some component of irreversible injury and arguably the most robust MR imaging predictor of injury severity.9,12,13,16) There is insufficient evidence to support other individual MR imaging features, including cord edema, swelling, and lesion length, for predicting neurologic outcomes in SCI.16) CM is most caudal part of spinal cord. Therefore we applied this prognostic method on T-CMS. Signal characteristics of MRI in spinal cord were also present in CM of T-CMS patients. Although signal characteristics and length of edema were significantly different between bladder function groups, the presence of intramedullary hemorrhage in CM was the only prognostic factor of bladder dysfunction in multivariate logistic regression model in T-CMS as found in studies of SCI.
The current study has several limitations. First, this was a retrospective study and it has the possibility of bias. To avoid this problem, we tried to collect consecutive patients to meet our inclusion and exclusion criteria and . Second, this study had a relatively small number of patients. However, this is the largest study demonstrating the prognosis and predictors of long-term bladder dysfunction in T-CMS. Third, our diagnosis of T-CMS is mostly based on radiological findings. We included patients with leg weakness or sensory change regardless of acute bladder dysfunction if the patients met radiological criteria of T-CMS. This is because there are several obstacles such as mental change, indwelling catheter, or distracting injury, to figure out clinical findings of T-CMS in acute setting. Last, our grade system of bladder function is too simple. There is a tool for measuring bladder function of SCI patients (SCIM, which is short for Spinal Cord Independence Measure). Item 6 is for bladder function. However, it is too complex. It classified as bladder function into 7 grades. And we believe our grade system is more practical tool reflecting the difficulty of patients in real clinical situation.
Conclusions
Results highlight the high prevalence of bladder dysfunction in the T-CMS patients. Presence of hemorrhage in CM is associated with an increased likelihood of neurogenic bladder dysfunction following T-CMS. Early prediction of bladder function using MRI at injury might optimize counselling and patient-tailored rehabilitative interventions and improve patient stratification in future clinical trials.
Fig. 1.
Diagnosis of acute traumatic conus medullaris syndrome on T2 weighted mid-sagittal MR image. (A) MR image of spinal cord injury showing acute vertebral fractures in T12, L1, and L2 with T2 hyperintensity on spinal cord without the involvement of conus medullaris. (B) MR image of conus medullaris syndrome showing acute vertebra fractures in T12 and L1 with T2 hyperintensity on conus medullaris. (C) MR image of cauda equine syndrome showing acute vertebral fracture in L2 with no involvement of conus medullaris. Bidirectional arrow represent whole length o conus medullaris.
Fig. 2.
Signal characteristics in conus medullaris of MR image. (A) Type I: MR image of simple compression of conus medullaris without signal change in conus medullaris. (B) Type II: MR image of intramedullary edema in conus medullaris manifesting as T2 hyperintensity on conus medullaris (white arrow). (C) Type III: MR image of intramedullary edema and hemorrhage manifesting as T2 hypointensity (grey arrow) surrounded by T2 hyperintensity.
Table 1.
Patient characteristics
Characteristics
Values
Age (years)
46.1±13.9 (15-73, 48)
Male gender
28
Cause of injury
High fall (≥1 m)
29
Low fall (<1 m)
3
Motor vehicle injury
4
Crushed with heavy object
3
Fracture type
Burst
31
Flexion-distraction
0
Fracture-dislocation
8
Fracture level
T12
6
L1
26
L2
7
Time to MRI, hours
38.4±120.8 (1.8-725.3, 7.5)
Signal characteristics of conus medullaris
Normal
4
One segment edema
19
Edema and hemorrhage
16
Length of edema on conus medullaris, mm
24.5±16.8 (0-61.3, 20.6)
Maximal AP canal length, mm
Preoperative
6.1±2.1 (1.7-9.9, 6.8)
Postoperative
12.5±2.5 (6.7-17.1, 12.6)
Maximal AP canal encroachment ratio, %
Preoperative
55.0±16.2 (29.0-88.3, 53.0)
Postoperative
12.8±13.4 (0-50.0, 9.3)
Time to surgery, hours
66.2±162.5 (6.1-951.1, 11.9)
Approach
Posterior only
31
Anterior + posterior
8
Results are expressed as N or mean – standard deviation. () means range and median value.
Table 2.
AIS Grade Conversion from Hospital admission to final assessment
2. Martin A, De Leener B, Cohen-Adad J, Cadotte D, Kalsi-Ryan S, Lange S, et al. Clinically feasible microstructural MRI to quantify cervical spinal cord tissue injury using DTI, MT, and T2*-weighted imaging: assessment of normative data and reliability. American Journal of Neuroradiology 2017.
3. Harrop JS, Hunt GE, Vaccaro AR. Conus medullaris and cauda equina syndrome as a result of traumatic injuries: management principles. Neurosurgical Focus 2004;16(6):1-23.
4. Brouwers E, van de Meent H, Curt A, Starremans B, Hosman A, Bartels R. Definitions of traumatic conus medullaris and cauda equina syndrome: a systematic literature review. Spinal cord 2017;55(10):886.
5. Rahimi-Movaghar V, Vaccaro AR, Mohammadi M. Efficacy of surgical decompression in regard to motor recovery in the setting of conus medullaris injury. The journal of spinal cord medicine 2006;29(1):32-8.
7. Korovessis P, Piperos G, Sidiropoulos P, Karagiannis A, Dimas T. Spinal canal restoration by posterior distraction or anterior decompression in thoracolumbar spinal fractures and its influence on neurological outcome. European Spine Journal 1994;3(6):318-24.
8. Pavese C, Schneider MP, Schubert M, Curt A, Scivoletto G, Finazzi-Agrò E, et al. Prediction of bladder outcomes after traumatic spinal cord injury: a longitudinal cohort study. PLoS medicine 2016;13(6):e1002041.
9. Rutges JP, Kwon BK, Heran M, Ailon T, Street JT, Dvorak MF. A prospective serial MRI study following acute traumatic cervical spinal cord injury. European Spine Journal 2017;26(9):2324-32.
10. Bozzo A, Marcoux J, Radhakrishna M, Pelletier J, Goulet B. The role of magnetic resonance imaging in the management of acute spinal cord injury. Journal of neurotrauma 2011;28(8):1401-11.
11. Wilson JR, Grossman RG, Frankowski RF, Kiss A, Davis AM, Kulkarni AV, et al. A clinical prediction model for long-term functional outcome after traumatic spinal cord injury based on acute clinical and imaging factors. Journal of neurotrauma 2012;29(13):2263-71.
12. Schaefer DM, Flanders AE, Osterholm JL, Northrup BE. Prognostic significance of magnetic resonance imaging in the acute phase of cervical spine injury. Journal of neurosurgery 1992;76(2):218-23.
13. Flanders AE, Schaefer DM, Doan HT, Mishkin MM, Gonzalez CF, Northrup B. Acute cervical spine trauma: correlation of MR imaging findings with degree of neurologic deficit. Radiology 1990;177(1):25-33.
14. Hackney DB, Asato R, Joseph PM, Carvlin M, McGrath J, Grossman R, et al. Hemorrhage and edema in acute spinal cord compression: demonstration by MR imaging. Radiology 1986;161(2):387-90.
15. Shepard M, Bracken M. Magnetic resonance imaging and neurological recovery in acute spinal cord injury: observations from the National Acute Spinal Cord Injury Study 3. Spinal Cord 1999;37(12):833.
18. Transfeldt EE, White D, Bradford DS, Roche B. Delayed anterior decompression in patients with spinal cord and cauda equina injuries of the thoracolumbar spine. Spine 1990;15(9):953-7.
19. Kingwell SP, Noonan VK, Fisher CG, Graeb DA, Keynan O, Zhang H, et al. Relationship of neural axis level of injury to motor recovery and health-related quality of life in patients with a thoracolumbar spinal injury. JBJS 2010;92(7):1591-9.
21. Willen J, Anderson J, Toomoka K, Singer K. The natural history of burst fractures at the thoracolumbar junction. Journal of spinal disorders 1990 Mar;3(1):39-46. Epub 1990/03/01.
22. McAfee PC, Bohlman HH, Yuan HA. Anterior decompression of traumatic thoracolumbar fractures with incomplete neurological deficit using a retroperitoneal approach. The Journal of bone and joint surgery American volume 1985 Jan;67(1):89-104. Epub 1985/01/01.
23. Podnar S. Epidemiology of cauda equina and conus medullaris lesions. Muscle & Nerve: Official Journal of the American Association of Electrodiagnostic Medicine 2007;35(4):529-31.
26. Kaneda K, Abumi K, Fujiya M. Burst fractures with neurologic deficits of the thoracolumbar-lumbar spine. Results of anterior decompression and stabilization with anterior instrumentation. Spine 1984;9(8):788-95.
27. Dall BE, Stauffer ES. Neurologic injury and recovery patterns in burst fractures at the T12 or L1 motion segment. Clinical orthopaedics and related research 1988;(233):171-6.
28. Haefeli J, Mabray MC, Whetstone WD, Dhall SS, Pan JZ, Upadhyayula P, et al. Multivariate analysis of MRI biomarkers for predicting neurologic impairment in cervical spinal cord injury. American Journal of Neuroradiology 2017;38(3):648-55.
29. Burns AS, Marino RJ, Flanders AE, Flett H. Clinical diagnosis and prognosis following spinal cord injury. Handbook of clinical neurology: Elsevier; 2012. p. 47-62.
MRI Signal Characteristics of Conus Medullaris Aids Prediction of Bladder Outcome in Traumatic Conus Medullaris Syndrome
Fig. 1. Diagnosis of acute traumatic conus medullaris syndrome on T2 weighted mid-sagittal MR image. (A) MR image of spinal cord injury showing acute vertebral fractures in T12, L1, and L2 with T2 hyperintensity on spinal cord without the involvement of conus medullaris. (B) MR image of conus medullaris syndrome showing acute vertebra fractures in T12 and L1 with T2 hyperintensity on conus medullaris. (C) MR image of cauda equine syndrome showing acute vertebral fracture in L2 with no involvement of conus medullaris. Bidirectional arrow represent whole length o conus medullaris.
Fig. 2. Signal characteristics in conus medullaris of MR image. (A) Type I: MR image of simple compression of conus medullaris without signal change in conus medullaris. (B) Type II: MR image of intramedullary edema in conus medullaris manifesting as T2 hyperintensity on conus medullaris (white arrow). (C) Type III: MR image of intramedullary edema and hemorrhage manifesting as T2 hypointensity (grey arrow) surrounded by T2 hyperintensity.
Fig. 1.
Fig. 2.
MRI Signal Characteristics of Conus Medullaris Aids Prediction of Bladder Outcome in Traumatic Conus Medullaris Syndrome
Characteristics
Values
Age (years)
46.1±13.9 (15-73, 48)
Male gender
28
Cause of injury
High fall (≥1 m)
29
Low fall (<1 m)
3
Motor vehicle injury
4
Crushed with heavy object
3
Fracture type
Burst
31
Flexion-distraction
0
Fracture-dislocation
8
Fracture level
T12
6
L1
26
L2
7
Time to MRI, hours
38.4±120.8 (1.8-725.3, 7.5)
Signal characteristics of conus medullaris
Normal
4
One segment edema
19
Edema and hemorrhage
16
Length of edema on conus medullaris, mm
24.5±16.8 (0-61.3, 20.6)
Maximal AP canal length, mm
Preoperative
6.1±2.1 (1.7-9.9, 6.8)
Postoperative
12.5±2.5 (6.7-17.1, 12.6)
Maximal AP canal encroachment ratio, %
Preoperative
55.0±16.2 (29.0-88.3, 53.0)
Postoperative
12.8±13.4 (0-50.0, 9.3)
Time to surgery, hours
66.2±162.5 (6.1-951.1, 11.9)
Approach
Posterior only
31
Anterior + posterior
8
Admission AIS grade
Final AIS grade
A
B
C
D
E
A
4
0
3
0
0
B
0
0
0
1
0
C
1
0
2
9
3
D
0
0
0
12
4
Complete (n=14)
Incomplete (n=12)
Normal (n=13)
p-value
Age (years)
48.1±12.7
47.8±13.1
42.2±16.0
0.491
Male gender
10
9
9
0.949
Cause of injury
High fall (≥1 m)
11
9
9
0.584
Low fall (<1 m)
0
2
1
Motor vehicle injury
2
1
1
Crushed with heavy object
1
0
2
AIS grade at injury
A
6
1
0
0.024*
B
0
1
0
C
3
7
5
D
5
3
8
Time to MRI (hrs)
18.6±46.3
15.9±23.7
80.4±201.2
0.315
Fracture type
Burst
7
12
12
0.003*
Flexion-distraction
0
0
0
Fracture-dislocation
7
0
1
Fracture level
T12
2
2
2
0.368
L1
9
10
7
L2
3
0
4
Maximal AP canal length (mm)
Preoperative
5.5±2.2
7.4±1.8
5.7±2.0
0.056
Postoperative
11.5±1.8
13.4±2.0
12.7±3.2
0.217
Maximal AP canal encroachment ratio (%)
Preoperative
59.3±18.2
45.8±13.8
57.7±14.8
0.081
Postoperative
17.1±13.8
7.5±9.7
13.1±16.5
0.122
Signal characteristics of conus medullaris
Normal
0
2
2
0.002*
Edema
2
6
11
Edema and hemorrhage
12
4
0
Length of edema on conus medullaris (mm)
38.3±14.7
20.7±14.3
13.3±9.9
<0.001*
Time to surgery (hrs)
16.3±9.9
42.7±64.5
141.7±264.8
0.110
Approach
Posterior only
11
10
10
0.919
Anterior + posterior
3
2
3
Characteristics
Odds Ratio (95% Confidence Interval)
p-value
Age per year
1.03 (0.98-1.08)
0.228
Male gender
1.21 (0.28-5.21)
0.801
Cause of injury
High fall (≥1m)
1
Low fall (<1m)
0.9 (0.07-11.25)
0.935
Motor vehicle injury
1.35 (0.12-14.82)
0.806
Crushed with heavy object
0.23 (0.18-2.81)
0.247
AIS grade at injury
Incomplete
1
Complete
4.11(0.44-38.23)
0.215
Time to MRI per hour
0.99 (0.98-1.01)
0.287
Fracture type
Burst
1
Fracture-dislocation
4.42 (0.48-40.56)
0.189*
Fracture level
T12
1
L1
1.36 (0.20-9.13)
0.753
L2
0.38 (0.04-3.61)
0.396
Maximal AP canal length per mm
Preoperative
1.15 (0.84-1.59)
0.387
Postoperative
0.94(0.72-1.24)
0.674
Maximal AP canal encroachment ratio per %
Preoperative
0.18 (0-10.80)
0.408
Postoperative
0.81(0.01-100.93)
0.934
Signal characteristics of conus medullaris
Normal
1
Edema
1.92 (0.24-15.35)
0.540
Edema and hemorrhage
19.5(2.20-173.49)
0.008*
Length of edema on conus medullaris
≤20mm
1
>20mm
1.09 (1.02-1.16)
0.009*
Time to surgery per hour
0.99 (0.98-1.00)
0.111*
Approach
Posterior only
1
Anterior + posterior
0.79 (0.16-4.00)
0.779
Table 1. Patient characteristics
Results are expressed as N or mean – standard deviation. () means range and median value.
Table 2. AIS Grade Conversion from Hospital admission to final assessment
Table 3. Comparison between bladder outcome groups
means p<0.05.
Table 4. Univariate comparisons of risk factors in patients with and without bladder dysfunction after acute traumatic conus medullaris syndrome