Development and Validation of a Diagnostic Nomogram for Sarcopenia in Patients with Degenerative Lumbar Disease: A Retrospective Diagnostic Accuracy Study in Korea
Department of Orthopaedic Surgery, Chung-Ang University Hospital, Chung-Ang University College of Medicine, Seoul, Korea
Corresponding author: Dae-Woong Ham, M.D. Department of Orthopaedic Surgery, Chung-Ang University Hospital, Chung-Ang University College of Medicine, 102 Heukseok-ro, Dongjak-gu, Seoul 06973, Korea TEL: +82-2-6299-2065, FAX: +82-2-6299-1575, E-mail: hamdgogo@gmail.com
• Received: May 8, 2026 • Revised: May 29, 2026 • Accepted: June 2, 2026
This is an open access article distributed under the terms of the Creative Commons Attribution Non-Commercial License (https://creativecommons.org/licenses/by-nc/4.0/) which permits unrestricted non-commercial use, distribution, and reproduction in any medium, provided the original work is properly cited.
A retrospective diagnostic accuracy study was conducted using internal training and temporal validation cohorts.
Purpose
This study aimed to develop and validate sex-specific diagnostic nomograms for sarcopenia in patients with degenerative lumbar disease (DLD), based on body mass index (BMI), hand-grip strength (HGS), and computed tomography (CT)–derived lumbar muscle indices.
Overview of Literature
The Asian Working Group for Sarcopenia (AWGS) 2019 algorithm requires appendicular skeletal muscle mass (ASM) measurement by dual-energy X-ray absorptiometry or bioimpedance analysis together with HGS and a physical performance test. These measurements are not always feasible in spine clinics, although a preoperative lumbar CT is routinely available.
Methods
A training set of 196 patients scheduled for lumbar surgery and a temporal validation set of 150 patients with DLD were analyzed. Sarcopenia was diagnosed according to the AWGS 2019 criteria. Sex-specific multivariable logistic regression was performed using BMI, HGS, psoas muscle index, paraspinal muscle index (PaMI), and gluteal muscle index (GMI), and the resulting models were translated into nomograms. Discrimination was assessed by the area under the receiver operating characteristic curve (AUC), calibration by calibration plots and mean absolute error (MAE), and the optimal cut-off was identified using the Youden index.
Results
The prevalence of sarcopenia was 62.2% (122/196) in the training set and 58.0% (87/150) in the validation set. In the training set, sarcopenic patients had significantly lower BMI (23.7±3.7 vs. 27.0±3.3 kg/m2), HGS (20.3±8.0 vs. 29.2±30.5 kg), PaMI (8.7±5.4 vs. 13.9±8.0), and GMI (26.1±5.7 vs. 30.9±6.2) than non-sarcopenic patients (all p<0.05). On validation, the male nomogram achieved an AUC of 0.958 with an MAE of 0.040, and the female nomogram achieved an AUC of 0.830 with an MAE of 0.021. The Youden index was 0.78 for males and 0.59 for females.
Conclusion
Sex-specific nomograms based on BMI, HGS, and CT-derived lumbar muscle indices provided accurate diagnosis of sarcopenia in patients with DLD without requiring whole-body ASM measurement or a physical performance test, offering a practical screening tool in the spine clinic.
Sarcopenia is a progressive and generalized skeletal muscle disorder characterized by accelerated loss of muscle mass and function, and is associated with falls, fractures, functional decline, prolonged hospitalization, and mortality in older adults.1,2) In patients with degenerative lumbar disease (DLD) who are candidates for spine surgery, coexisting sarcopenia has been reported to be associated with greater preoperative disability, higher rates of perioperative complications, slower postoperative recovery, and inferior patient-reported outcomes.3-5) Identifying sarcopenia before surgery is therefore clinically meaningful and may inform preoperative optimization, prehabilitation, and shared decision-making.
The Asian Working Group for Sarcopenia (AWGS) 2019 algorithm requires the measurement of appendicular skeletal muscle mass (ASM) by dual-energy X-ray absorptiometry (DXA) or bioimpedance analysis (BIA), together with hand-grip strength (HGS) and a physical performance test such as a 6-meter gait speed or the 5-times sit-to-stand test.1) Although this multi-component diagnostic algorithm is well validated, it is not always practical in busy spine outpatient clinics, where DXA or BIA equipment may not be readily available and where physical performance testing is often constrained by pain and limited mobility.6,7) As a result, sarcopenia in surgical candidates is frequently undiagnosed and undertreated.
Lumbar computed tomography (CT) is routinely obtained as part of the preoperative workup for DLD, and provides a unique opportunity to quantify regional muscle mass at the lumbar level. CT-based indices of the psoas muscle, paraspinal muscle, and gluteal muscle have been shown to correlate with whole-body skeletal muscle mass and to predict adverse outcomes.8-10) Combining these CT-derived indices with simple bedside measures such as body mass index (BMI) and HGS may therefore enable accurate diagnosis of sarcopenia without the need for whole-body ASM measurement or a formal physical performance test.
Nomograms are visual graphical scoring systems based on multivariable regression models that translate complex statistical predictions into clinically interpretable individual scores.11) Although nomograms for sarcopenia have been proposed in community-dwelling older adults,11) to our knowledge, no diagnostic nomogram has been developed and validated specifically for patients with DLD using only BMI, HGS, and CT-derived lumbar muscle indices. The objective of the present study was therefore to develop and validate sex-specific diagnostic nomograms for sarcopenia in patients with DLD.
Methods
1. Study design and participants
This was a single-center, retrospective diagnostic accuracy study using a training cohort and an independent temporal validation cohort, both enrolled at Chung-Ang University Hospital.
The training cohort consisted of 196 consecutive patients with DLD who were scheduled for elective lumbar spine surgery between January 2019 and December 2021 and who underwent preoperative evaluation including lumbar CT, BMI measurement, HGS testing, and the AWGS 2019–based sarcopenia work-up. Inclusion criteria were as follows: (1) age ≥ 50 years; (2) a clinical diagnosis of DLD, comprising lumbar spinal stenosis or lumbar disc herniation; and (3) availability of preoperative lumbar CT covering the L3 vertebral level. Exclusion criteria were as follows: (1) prior lumbar fusion or instrumented surgery; (2) spinal infection, primary or metastatic spinal tumor, or vertebral fracture; (3) any neuromuscular disorder potentially affecting muscle composition; and (4) incomplete preoperative data for any of the candidate variables. Of the 196 training patients, 173 had lumbar spinal stenosis (88.3%), and 23 had lumbar disc herniation (11.7%). The validation cohort consisted of 150 independent patients with DLD evaluated between January 2022 and June 2023 using the same inclusion and exclusion criteria.
2. Diagnosis of sarcopenia
Sarcopenia was diagnosed according to the AWGS 2019 criteria.1) ASM was measured by BIA, and the appendicular skeletal muscle mass index (ASMI) was calculated as ASM divided by height squared (kg/m2). Low muscle mass was defined as ASMI <7.0 kg/m2 in men and <5.7 kg/m2 in women. HGS was measured using a digital hand dynamometer with the dominant hand in the standing position with full elbow extension. Patients performed at least two trials, and the maximum value was recorded. Low muscle strength was defined as HGS <28.0 kg in men and <18.0 kg in women. Physical performance was assessed using a 6-meter gait speed test, and low physical performance was defined as a gait speed <1.0 m/s. Patients meeting the criterion for low ASMI together with either low HGS or low physical performance were classified as having sarcopenia.
3. CT-based muscle indices
All patients underwent preoperative lumbar CT as part of routine clinical care. The cross-sectional areas (CSAs, in cm2) of the bilateral psoas muscles, paraspinal muscles (erector spinae and multifidus), and gluteal muscles were measured on a single axial slice at the mid-level of the L3 vertebral body using a picture archiving and communication system. Muscle boundaries were manually delineated, and the area within a Hounsfield unit window of −29 to 150 was considered muscle tissue. To adjust for body size, three muscle indices were defined: the psoas muscle index (PMI)=(right+left psoas CSA)/height2 (cm2/m2); the paraspinal muscle index (PaMI)=(right+left paraspinal CSA)/height2 (cm2/m2); and the gluteal muscle index (GMI)=(right+left gluteal CSA)/height2 (cm2/m2). Measurements were performed by a single trained investigator who was blinded to the AWGS-based sarcopenia status.
4. Candidate variables and model development
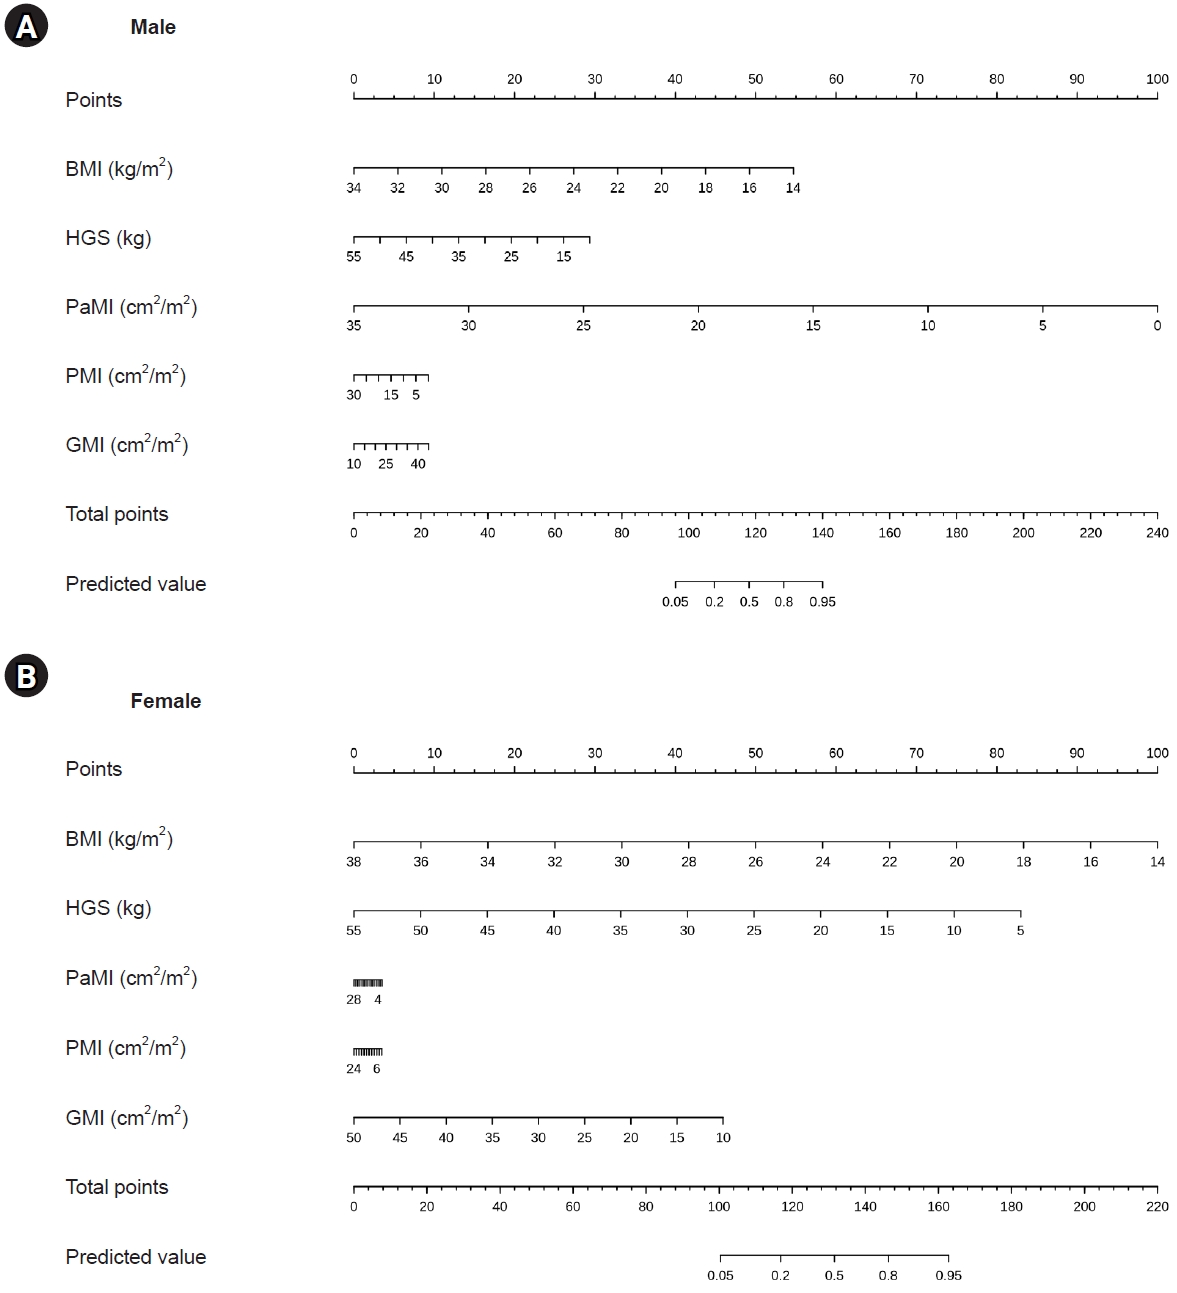
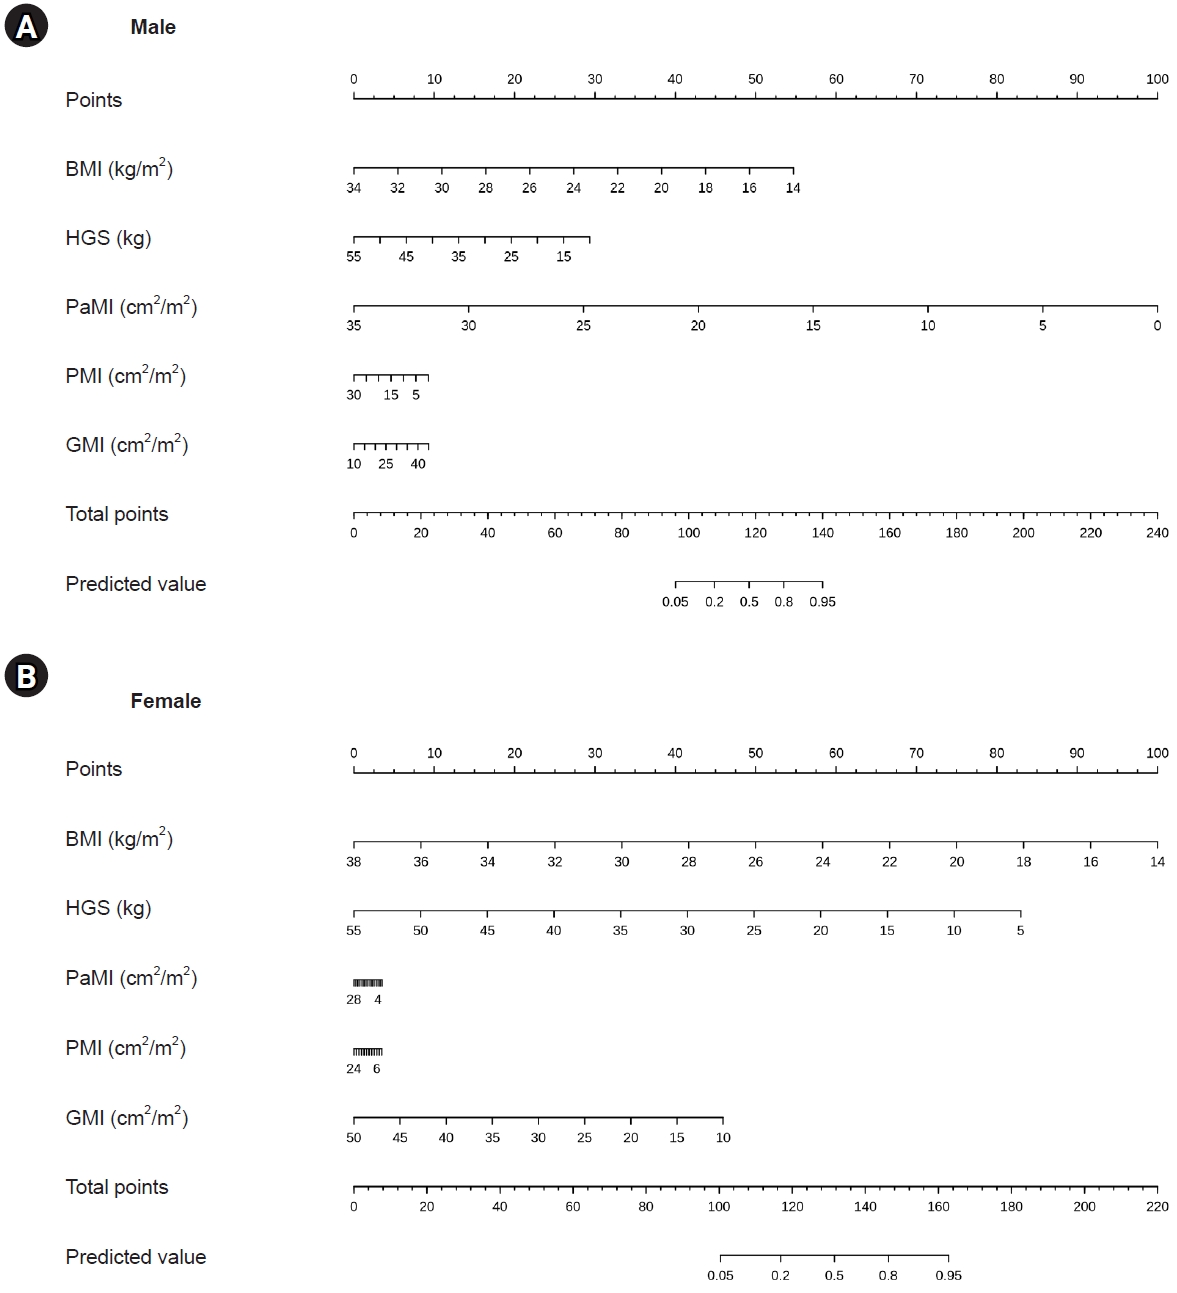
Five candidate predictors were prespecified based on clinical availability and biological plausibility: BMI, HGS, PaMI, PMI, and GMI. Because the diagnostic thresholds of the AWGS 2019 algorithm are sex-specific and because muscle morphology differs substantially between sexes, multivariable logistic regression models were fitted separately for male and female patients in the training set. All five predictors were entered into the model as continuous variables. Odds ratios with 95% confidence intervals (CIs) were estimated. The final regression equations were translated into sex-specific nomograms using the rms package in R, which assigned points to each predictor on a 0–100 scale and converted the total points into the predicted probability of sarcopenia (Fig. 1).
5. Model validation
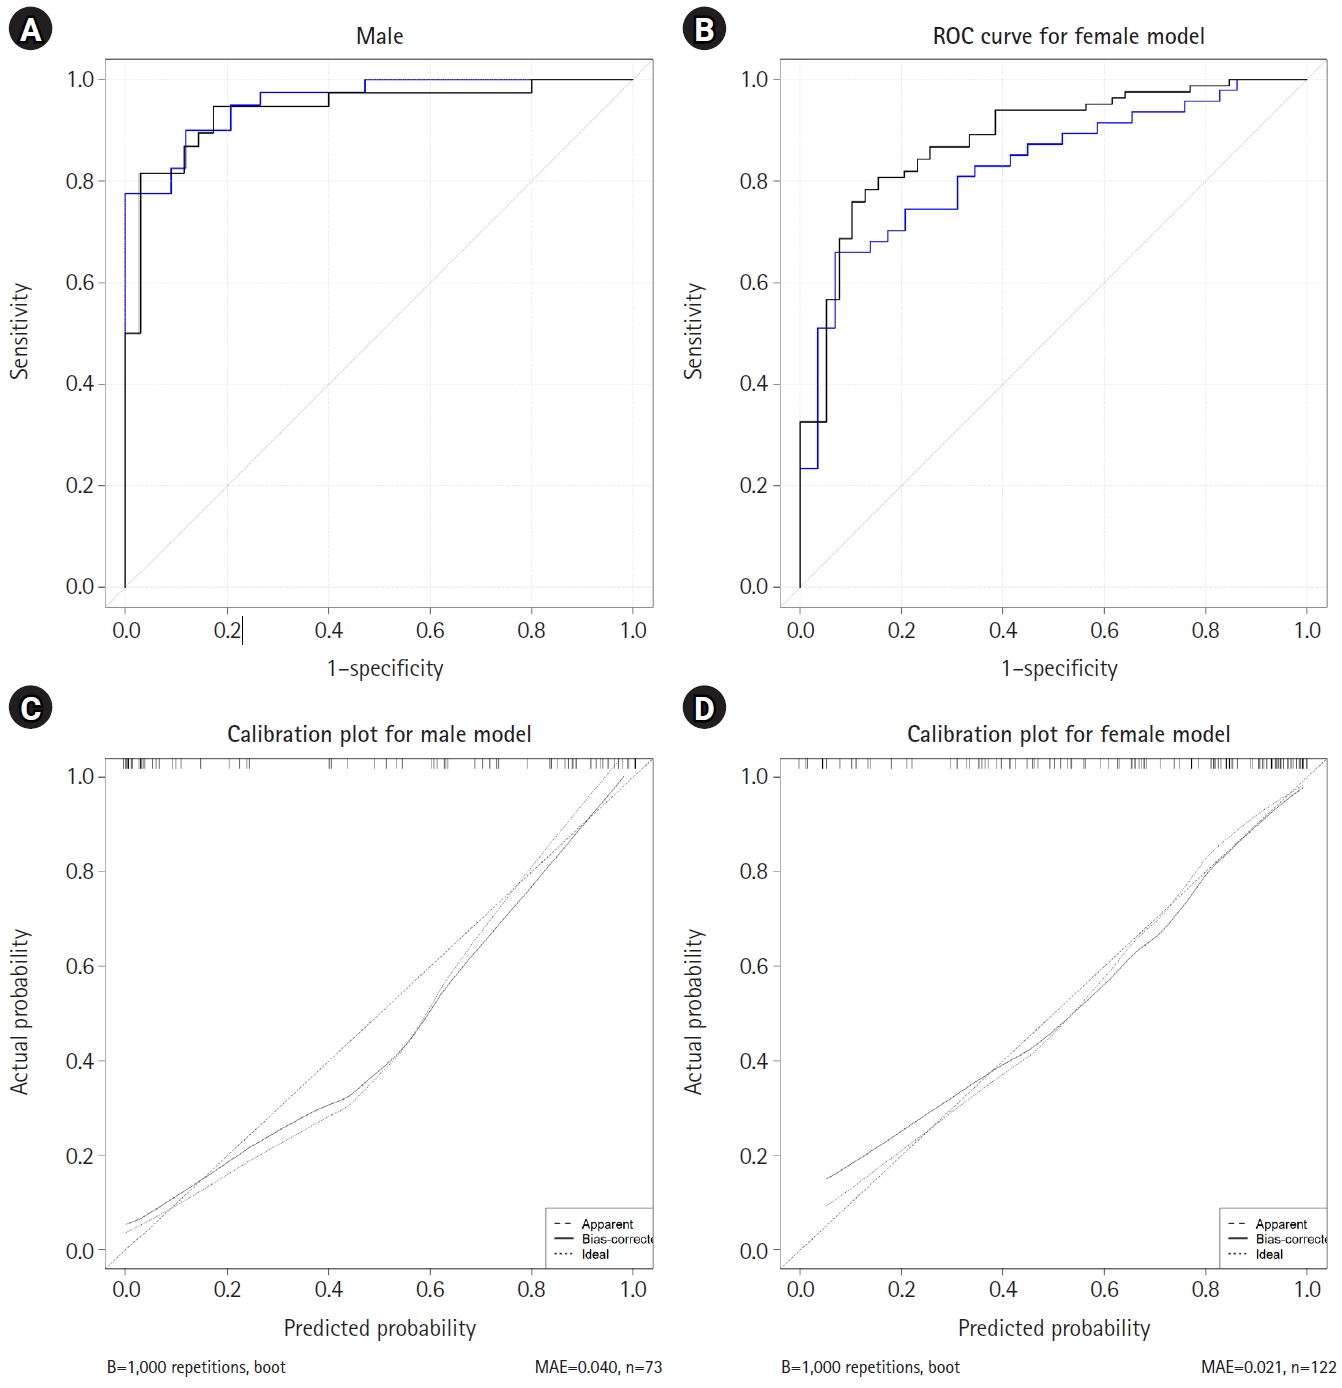
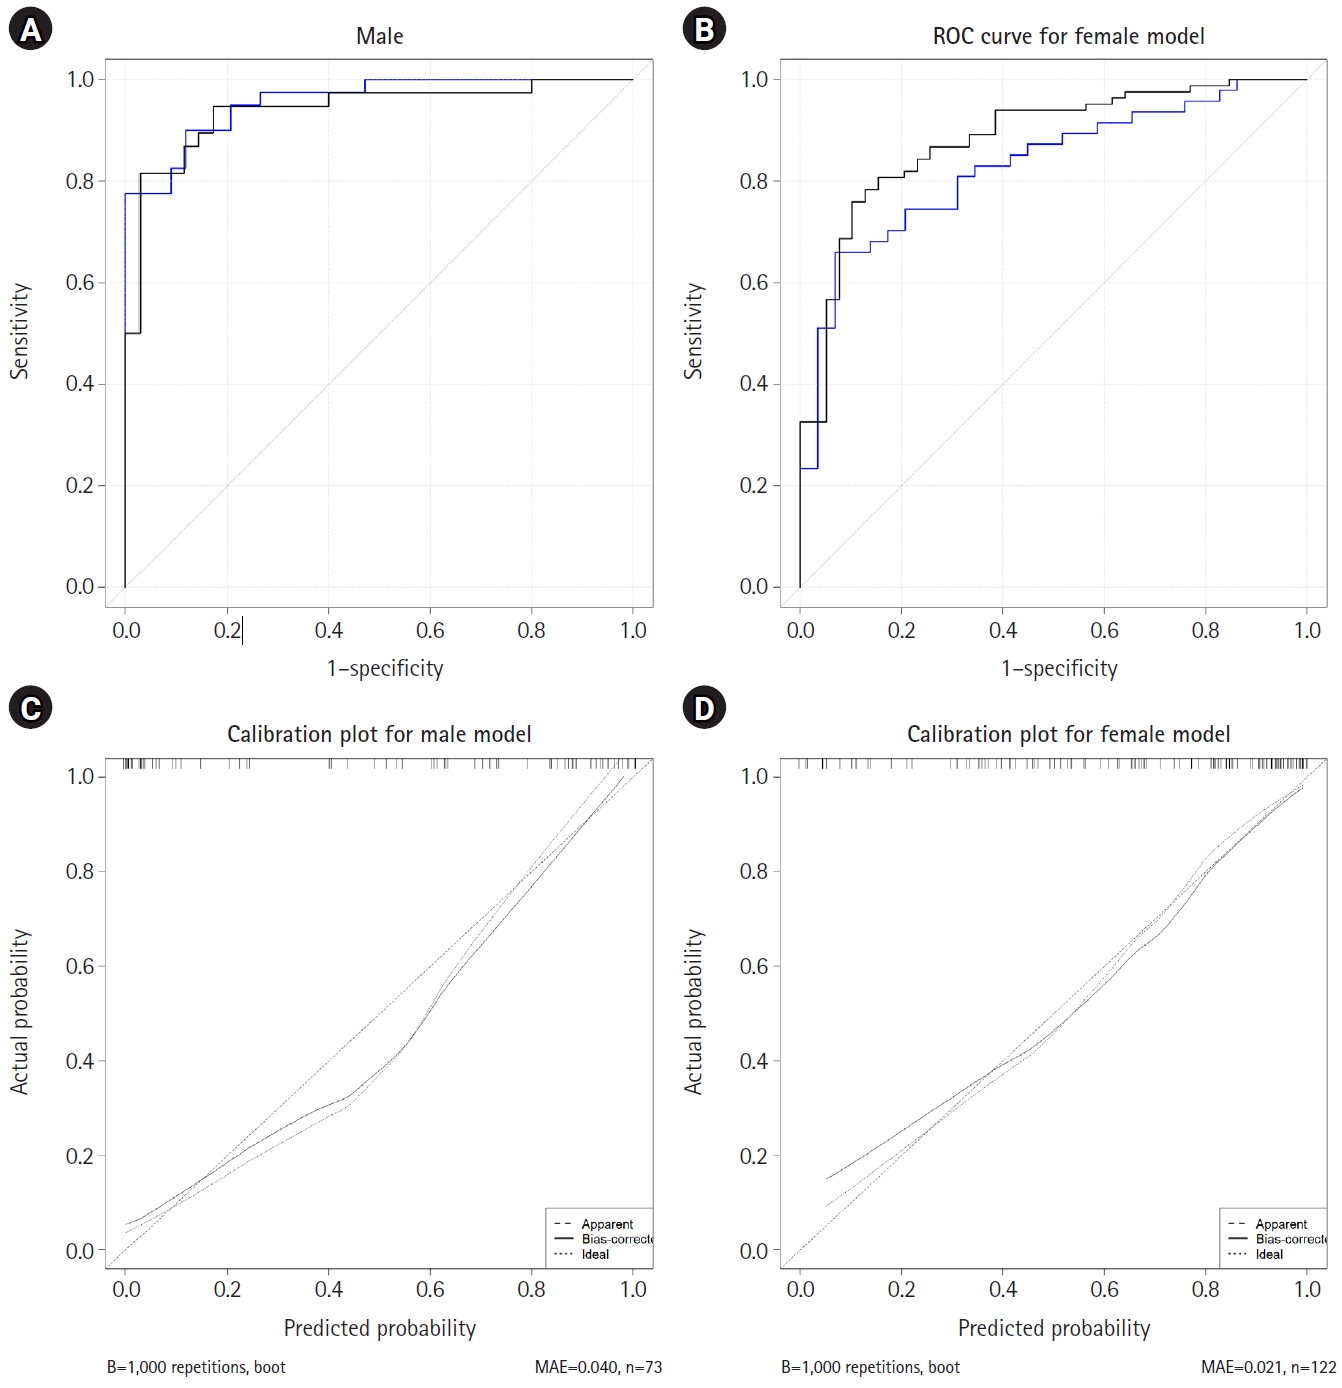
The performance of each sex-specific nomogram was evaluated in the independent validation cohort. Discrimination was quantified using the area under the receiver operating characteristic curve (AUC) with 95% CIs (Fig. 2A, 2B). Calibration was evaluated using calibration plots based on 1,000 bootstrap resamples, and the mean absolute error (MAE) between predicted and observed probabilities was reported (Fig. 2C, 2D). The optimal cut-off probability for diagnosis of sarcopenia was determined by maximizing the Youden index (sensitivity+specificity−1), and the corresponding sensitivity, specificity, and accuracy were reported.
6. Statistical analysis
Continuous variables are presented as mean±standard deviation, and categorical variables as frequencies and percentages. Between-group comparisons used the independent t-test or the Mann-Whitney U test for continuous variables, and the chi-square test or Fisher’s exact test for categorical variables, as appropriate. A two-sided p-value of less than 0.05 was considered statistically significant. All analyses were performed using R version 4.2.2 (R Foundation for Statistical Computing, Vienna, Austria) with the rms, pROC, and ggplot2 packages.
7. Ethics statement
The study was approved by the Institutional Review Board of Chung-Ang University Hospital (IRB No. 2022-02-451) and was conducted in accordance with the Declaration of Helsinki. This study is reported in keeping with the relevant items of the TRIPOD (Transparent Reporting of a multivariable prediction model for Individual Prognosis Or Diagnosis) statement.12) The requirement for written informed consent was waived owing to the retrospective nature of the analysis.
Results
1. Baseline characteristics of the training cohort
A total of 196 patients with DLD were included in the training cohort, of whom 122 (62.2%) were classified as having sarcopenia according to the AWGS 2019 criteria. The relatively high prevalence of sarcopenia is consistent with the advanced age and surgical candidacy of the study population. The proportion of women was higher in the sarcopenic group than in the non-sarcopenic group (68.9% vs. 52.7%, p=0.034). Sarcopenic patients were significantly older (73.6±6.5 vs. 70.6±6.8 years, p=0.002) and had significantly lower bone mineral density (0.613±0.140 vs. 0.686±0.122 g/cm2, p<0.001). BMI, HGS, PaMI, and GMI were all significantly lower in the sarcopenic group, whereas PMI did not differ significantly between the two groups (Table 1).
2. Baseline characteristics of the validation cohort
The validation cohort comprised 150 patients with DLD evaluated during a separate enrollment period (January 2022–June 2023), of whom 87 (58.0%) were classified as sarcopenic. Compared with non-sarcopenic patients, sarcopenic patients in the validation cohort were significantly older (70.7±10.3 vs. 65.8±11.9 years, p=0.037) and had significantly lower BMI (24.5±3.2 vs. 28.3±2.6 kg/m2, p<0.001) and GMI (27.9±4.3 vs. 32.1±4.8, p<0.001). The sex distribution and other variables were comparable between sarcopenic and non-sarcopenic patients (Table 2). When the training and validation cohorts were compared as a whole, the prevalence of sarcopenia was similar (62.2% vs. 58.0%, p=0.491), although the validation cohort had a lower proportion of women, slightly younger age, and significantly higher PaMI and lower PMI, reflecting differences in case mix (Table 3).
3. Sex-specific diagnostic nomograms
Sex-specific multivariable logistic regression models were fitted in the training set using BMI, HGS, PaMI, PMI, and GMI as predictors. The regression coefficients were translated into nomograms in which each predictor contributed a number of points on a 0–100 scale; the sum of points across the five predictors was converted into the predicted probability of sarcopenia (Fig. 1).
4. Model performance in the validation cohort
In the independent validation cohort, the male nomogram achieved excellent discrimination, with an AUC of 0.958, while the female nomogram showed good discrimination, with an AUC of 0.830 (Fig. 2A, 2B). The calibration plots demonstrated good agreement between predicted and observed probabilities for both sexes, with an MAE of 0.040 for males (n=73) and 0.021 for females (n=122), indicating that the nomograms were well calibrated across the full range of risk (Fig. 2C, 2D). When the optimal cut-off was selected by maximizing the Youden index, the index was 0.78 for the male model and 0.59 for the female model, indicating high sensitivity and specificity for the diagnosis of sarcopenia in both sexes.
Discussion
The present study developed and validated sex-specific diagnostic nomograms for sarcopenia in patients with DLD using BMI, HGS, and three CT-derived lumbar muscle indices (PMI, PaMI, and GMI). In an independent temporal validation cohort, the male nomogram achieved excellent discrimination (AUC 0.958) and the female nomogram showed good discrimination (AUC 0.830), and both models were well calibrated, with MAEs of 0.040 and 0.021, respectively. These results suggest that the proposed nomograms allow accurate diagnosis of sarcopenia in patients with DLD without requiring whole-body ASM measurement or a formal physical performance test.
The clinical importance of identifying sarcopenia in patients with DLD has been increasingly recognized.3,13) Sarcopenia has been associated with greater preoperative disability, longer hospital stay, higher complication rates, and inferior patient-reported outcomes after lumbar spine surgery.3-5) Despite these implications, the routine application of the AWGS 2019 algorithm in spine outpatient clinics remains limited because DXA or BIA equipment is not always available and because physical performance testing is often constrained by pain and gait disturbance in surgical candidates.6,7) A diagnostic tool that relies only on parameters routinely collected during the preoperative spine workup is therefore highly desirable. Lumbar CT, BMI, and HGS are typically obtained as part of routine care,14) and repurposing these data to derive a sarcopenia probability minimizes additional patient burden and clinical resources.
Previous studies have shown that lumbar CT-based muscle indices correlate with whole-body skeletal muscle mass and predict adverse outcomes.8,9,10,14) The psoas muscle has been the most widely studied marker, but isolated PMI has shown inconsistent associations with whole-body sarcopenia, particularly in women.9,10) In the present training cohort, PMI alone did not differ significantly between sarcopenic and non-sarcopenic patients, whereas PaMI and GMI showed strong univariate associations with sarcopenia. This finding is consistent with prior reports that paraspinal and gluteal muscles, which contain a larger proportion of postural type I fibers and a wider CSA, may better reflect global muscle mass than the psoas alone.9) Combining the three muscle indices with BMI and HGS in a multivariable model, therefore, appears more informative than reliance on any single muscle measurement.
Yin et al.11) previously developed a nomogram to predict sarcopenia in community-dwelling older adults using age, albumin, blood urea nitrogen, grip strength, and calf circumference, and reported a validation AUC of 0.92. Although their model demonstrated excellent performance, it was developed in a general medical examination cohort rather than in a spine surgical population, and it required laboratory tests and calf circumference measurement that are not part of the routine spine workup. The present nomograms are tailored to the DLD population and rely instead on data that are already available preoperatively, which enhances their applicability in the spine clinic.
The prevalence of sarcopenia in this study was 62.2% in the training cohort and 58.0% in the validation cohort, which is considerably higher than the 10%–30% typically reported in community-dwelling older adults.1,13) This is likely attributable to the fact that the study population consisted exclusively of patients with DLD who were candidates for lumbar spine surgery, a group that tends to be older, more functionally impaired, and more likely to have reduced physical activity owing to chronic pain and limited mobility.
This study has several limitations that should be acknowledged. First, the analysis was retrospective and conducted at a single institution; the generalizability of the nomograms to other ethnicities, healthcare settings, and CT acquisition protocols requires confirmation in prospective multicenter cohorts. Second, the validation cohort, although collected during an independent enrollment period, was drawn from the same institutional source as the training cohort; external validation in a geographically separate population is warranted. Third, the case mix differed slightly between the training and validation cohorts in terms of sex distribution, age, and muscle index distributions; in particular, the PMI values were substantially higher in the training cohort than in the validation cohort, which may reflect differences in measurement technique or inter-observer variability between the two enrollment periods. Despite this discrepancy, both nomograms maintained good performance, suggesting reasonable robustness. Fourth, raw inspection of the training set identified a small number of extreme values for HGS and PMI that may reflect measurement or data-entry artifacts; these values were retained in the analysis to preserve the prespecified analytic plan, but the resulting wider variance is reflected in the standard deviations reported in Table 1 and should be interpreted with caution. Fifth, CT-based muscle indices were measured by a single observer; although this minimized inter-observer variability within each cohort, the inter- and intra-observer reproducibility of the measurements could not be quantified. Sixth, the nomograms are intended as a diagnostic screening tool rather than as a replacement for the AWGS 2019 algorithm, and patients with a high predicted probability should still undergo formal sarcopenia work-up whenever feasible.
In conclusion, sex-specific nomograms based on BMI, HGS, and CT-derived PMI, PaMI, and GMI provided accurate and well-calibrated diagnosis of sarcopenia in patients with DLD. These nomograms can serve as a practical screening tool in the spine clinic, leveraging data that are already collected during routine preoperative evaluation, and may facilitate earlier recognition and management of sarcopenia in surgical candidates with DLD.
NOTES
Conflict of interest
The author has no conflicts of interest to declare.
Funding
None.
Acknowledgments
None.
Fig. 1.
Sex-specific diagnostic nomograms for sarcopenia in patients with degenerative lumbar disease. (A) Male nomogram. (B) Female nomogram. Each predictor (body mass index [BMI], hand-grip strength [HGS], paraspinal muscle index [PaMI], psoas muscle index [PMI], and gluteal muscle index [GMI]) is assigned a number of points on a 0–100 scale; the sum of the points across all predictors is converted into the predicted probability of sarcopenia.
Fig. 2.
Performance of the sex-specific nomograms in the independent validation cohort. (A) Receiver operating characteristic (ROC) curve for the male model. (B) ROC curve for the female model. (C) Calibration plot for the male model (mean absolute error [MAE]=0.040, n=73). (D) Calibration plot for the female model (MAE=0.021, n=122). In the calibration plots, the dashed line indicates ideal calibration; the solid line indicates the bias-corrected calibration based on 1,000 bootstrap resamples.
Table 1.
Baseline characteristics of the training cohort according to sarcopenia status
Variable
Non-sarcopenia (n=74)
Sarcopenia (n=122)
Total (n=196)
p-value
Female sex
39 (52.7)
84 (68.9)
123 (62.8)
0.034
Age (years)
70.6±6.8
73.6±6.5
72.4±6.8
0.002
BMD (g/cm2)
0.686±0.122
0.613±0.140
0.640±0.138
<0.001
BMI (kg/m2)
27.0±3.3
23.7±3.7
24.9±3.9
<0.001
HGS (kg)
29.2±30.5
20.3±8.0
23.7±20.2
0.016
PaMI (cm2/m2)
13.9±8.0
8.7±5.4
10.6±6.9
<0.001
PMI (cm2/m2)
11.5±17.4
10.2±5.5
10.7±11.6
0.525
GMI (cm2/m2)
30.9±6.2
26.1±5.7
27.9±6.4
<0.001
Values are presented as number (%) or mean±standard deviation. BMD: bone mineral density, BMI: body mass index, HGS: hand-grip strength, PaMI: paraspinal muscle index, PMI: psoas muscle index, GMI: gluteal muscle index.
Table 2.
Baseline characteristics of the validation cohort according to sarcopenia status
Variable
Non-sarcopenia (n=63)
Sarcopenia (n=87)
Total (n=150)
p-value
Female sex
29 (46.0)
47 (54.0)
76 (50.7)
0.423
Age (years)
65.8±11.9
70.7±10.3
69.2±11.0
0.037
BMD (g/cm2)
0.681±0.126
0.648±0.167
0.658±0.156
0.350
BMI (kg/m2)
28.3±2.6
24.5±3.2
25.7±3.5
<0.001
HGS (kg)
26.5±12.1
22.1±10.3
23.5±11.0
0.057
PaMI (cm2/m2)
14.9±4.8
14.0±3.4
14.3±3.8
0.402
PMI (cm2/m2)
5.4±1.9
4.8±1.4
5.0±1.6
0.153
GMI (cm2/m2)
32.1±4.8
27.9±4.3
29.2±4.9
<0.001
Values are presented as number (%) or mean±standard deviation. BMD: bone mineral density, BMI: body mass index, HGS: hand-grip strength, PaMI: paraspinal muscle index, PMI: psoas muscle index, GMI: gluteal muscle index.
Table 3.
Comparison of the training and validation cohorts
Variable
Training (n=196)
Validation (n=150)
Total (n=346)
p-value
Sarcopenia
122 (62.2)
87 (58.0)
209 (60.4)
0.491
Female sex
123 (62.8)
76 (50.7)
199 (57.5)
0.032
Age (years)
72.4±6.8
69.2±11.0
71.3±8.6
0.007
BMD (g/cm2)
0.640±0.138
0.658±0.156
0.646±0.144
0.330
BMI (kg/m2)
24.9±3.9
25.7±3.5
25.2±3.8
0.115
HGS (kg)
23.7±20.2
23.5±11.0
23.6±17.5
0.894
PaMI (cm2/m2)
10.6±6.9
14.3±3.8
11.8±6.3
<0.001
PMI (cm2/m2)
10.7±11.6
5.0±1.6
8.8±9.9
<0.001
GMI (cm2/m2)
27.9±6.4
29.2±4.9
28.3±6.0
0.069
Values are presented as number (%) or mean±standard deviation. BMD: bone mineral density, BMI: body mass index, HGS: hand-grip strength, PaMI: paraspinal muscle index, PMI: psoas muscle index, GMI: gluteal muscle index.
References
1. Chen LK, Woo J, Assantachai P, et al. Asian Working Group for Sarcopenia: 2019 consensus update on sarcopenia diagnosis and treatment. J Am Med Dir Assoc 2020;21:300-7.
4. Chen MJ, Lo YS, Lin CY, et al. Impact of sarcopenia on outcomes following lumbar spine surgery for degenerative disease: an updated systematic review and meta-analysis. Eur Spine J 2024;33:3369-80.
5. Bokshan SL, Han AL, DePasse JM, et al. Effect of sarcopenia on postoperative morbidity and mortality after thoracolumbar spine surgery. Orthopedics 2016;39:e1159-64.
6. Inose H, Yamada T, Hirai T, Yoshii T, Abe Y, Okawa A. The impact of sarcopenia on the results of lumbar spinal surgery. Osteoporos Sarcopenia 2018;4:33-6.
8. Hamaguchi Y, Kaido T, Okumura S, et al. Proposal for new diagnostic criteria for low skeletal muscle mass based on computed tomography imaging in Asian adults. Nutrition 2016;32:1200-5.
9. Ham DW, Lee J, Choi G, Kwon BT, Song KS. The cross-sectional area of gluteal muscle on multiaxial CT scan as a predictor for diagnosing sarcopenia in patients with degenerative lumbar disease. Eur Spine J 2024;33:3857-64.
10. Gibson DJ, Burden ST, Strauss BJ, Todd C, Lal S. The role of computed tomography in evaluating body composition and the influence of reduced muscle mass on clinical outcome in abdominal malignancy: a systematic review. Eur J Clin Nutr 2015;69:1079-86.
12. Collins GS, Reitsma JB, Altman DG, Moons KG. Transparent reporting of a multivariable prediction model for individual prognosis or diagnosis (TRIPOD): the TRIPOD statement. BMJ 2015;350:g7594.
14. Zhuang CL, Zhang FM, Li W, et al. Associations of low handgrip strength with cancer mortality: a multicentre observational study. J Cachexia Sarcopenia Muscle 2020;11:1476-86.
Development and Validation of a Diagnostic Nomogram for Sarcopenia in Patients with Degenerative Lumbar Disease: A Retrospective Diagnostic Accuracy Study in Korea
Fig. 1. Sex-specific diagnostic nomograms for sarcopenia in patients with degenerative lumbar disease. (A) Male nomogram. (B) Female nomogram. Each predictor (body mass index [BMI], hand-grip strength [HGS], paraspinal muscle index [PaMI], psoas muscle index [PMI], and gluteal muscle index [GMI]) is assigned a number of points on a 0–100 scale; the sum of the points across all predictors is converted into the predicted probability of sarcopenia.
Fig. 2. Performance of the sex-specific nomograms in the independent validation cohort. (A) Receiver operating characteristic (ROC) curve for the male model. (B) ROC curve for the female model. (C) Calibration plot for the male model (mean absolute error [MAE]=0.040, n=73). (D) Calibration plot for the female model (MAE=0.021, n=122). In the calibration plots, the dashed line indicates ideal calibration; the solid line indicates the bias-corrected calibration based on 1,000 bootstrap resamples.
Fig. 1.
Fig. 2.
Development and Validation of a Diagnostic Nomogram for Sarcopenia in Patients with Degenerative Lumbar Disease: A Retrospective Diagnostic Accuracy Study in Korea
Variable
Non-sarcopenia (n=74)
Sarcopenia (n=122)
Total (n=196)
p-value
Female sex
39 (52.7)
84 (68.9)
123 (62.8)
0.034
Age (years)
70.6±6.8
73.6±6.5
72.4±6.8
0.002
BMD (g/cm2)
0.686±0.122
0.613±0.140
0.640±0.138
<0.001
BMI (kg/m2)
27.0±3.3
23.7±3.7
24.9±3.9
<0.001
HGS (kg)
29.2±30.5
20.3±8.0
23.7±20.2
0.016
PaMI (cm2/m2)
13.9±8.0
8.7±5.4
10.6±6.9
<0.001
PMI (cm2/m2)
11.5±17.4
10.2±5.5
10.7±11.6
0.525
GMI (cm2/m2)
30.9±6.2
26.1±5.7
27.9±6.4
<0.001
Variable
Non-sarcopenia (n=63)
Sarcopenia (n=87)
Total (n=150)
p-value
Female sex
29 (46.0)
47 (54.0)
76 (50.7)
0.423
Age (years)
65.8±11.9
70.7±10.3
69.2±11.0
0.037
BMD (g/cm2)
0.681±0.126
0.648±0.167
0.658±0.156
0.350
BMI (kg/m2)
28.3±2.6
24.5±3.2
25.7±3.5
<0.001
HGS (kg)
26.5±12.1
22.1±10.3
23.5±11.0
0.057
PaMI (cm2/m2)
14.9±4.8
14.0±3.4
14.3±3.8
0.402
PMI (cm2/m2)
5.4±1.9
4.8±1.4
5.0±1.6
0.153
GMI (cm2/m2)
32.1±4.8
27.9±4.3
29.2±4.9
<0.001
Variable
Training (n=196)
Validation (n=150)
Total (n=346)
p-value
Sarcopenia
122 (62.2)
87 (58.0)
209 (60.4)
0.491
Female sex
123 (62.8)
76 (50.7)
199 (57.5)
0.032
Age (years)
72.4±6.8
69.2±11.0
71.3±8.6
0.007
BMD (g/cm2)
0.640±0.138
0.658±0.156
0.646±0.144
0.330
BMI (kg/m2)
24.9±3.9
25.7±3.5
25.2±3.8
0.115
HGS (kg)
23.7±20.2
23.5±11.0
23.6±17.5
0.894
PaMI (cm2/m2)
10.6±6.9
14.3±3.8
11.8±6.3
<0.001
PMI (cm2/m2)
10.7±11.6
5.0±1.6
8.8±9.9
<0.001
GMI (cm2/m2)
27.9±6.4
29.2±4.9
28.3±6.0
0.069
Table 1. Baseline characteristics of the training cohort according to sarcopenia status
Values are presented as number (%) or mean±standard deviation. BMD: bone mineral density, BMI: body mass index, HGS: hand-grip strength, PaMI: paraspinal muscle index, PMI: psoas muscle index, GMI: gluteal muscle index.
Table 2. Baseline characteristics of the validation cohort according to sarcopenia status
Values are presented as number (%) or mean±standard deviation. BMD: bone mineral density, BMI: body mass index, HGS: hand-grip strength, PaMI: paraspinal muscle index, PMI: psoas muscle index, GMI: gluteal muscle index.
Table 3. Comparison of the training and validation cohorts
Values are presented as number (%) or mean±standard deviation. BMD: bone mineral density, BMI: body mass index, HGS: hand-grip strength, PaMI: paraspinal muscle index, PMI: psoas muscle index, GMI: gluteal muscle index.