1)Department of Orthopaedic Surgery, Catholic Kwandong University College of Medicine, International St. Mary’s Hospital, Incheon, Korea
2)Department of Orthopaedic Surgery, Chungnam National University Sejong Hospital, Sejong, Korea
3)College of Medicine, Catholic Kwandong Graduate School, Gangneung, Korea
4)Walk101 Co., Ltd., Incheon, Republic of Korea
Corresponding author: Dong-Sik Chae, M.D., Ph.D. Department of Orthopaedic Surgery, Catholic Kwandong University College of Medicine, International St. Mary’s Hospital, 25, Simgok-ro 100beon-gil, Seogu, Incheon, 22711, Korea TEL: +82-32-290-3879, FAX: +82-44-995-5792 E-mail: drchaeos@gmail.com
Co-corresponding author: Sang-Bum Kim, M.D., Ph.D. Department of Orthopaedic Surgery, Chungnam National University Sejong Hospital, 20 Bodeum-ro, Sejong-si, 30099, Korea TEL: +82-44-995-5792, FAX: +82-44-995-5799 E-mail: sangbumos@me.com
*These authors contributed equally to this work. †These authors contributed equally and are co-corresponding authors.
This is an open access article distributed under the terms of the Creative Commons Attribution Non-Commercial License (http://creativecommons.org/licenses/by-nc/4.0/) which permits unrestricted non-commercial use, distribution, and reproduction in any medium, provided the original work is properly cited.
To evaluate the association between lumbar lordosis and age using an AI-based automated measurement model applied to a large dataset of standing lateral spinal radiographs.
Materials and Methods
This retrospective study analyzed 904 high-quality radiographs selected from 2,397 images acquired between 2019 and 2021. Lumbar lordosis was defined as the angle between the superior endplates of L1 and S1 and automatically measured using a validated deep learning model. Subjects were categorized into nine age groups. One-way ANOVA compared lumbar lordosis across age groups, and Pearson correlation assessed the relationship between age and lumbar lordosis.
Results
Lumbar lordosis ranged from 0° to 84° (mean 45.9°±13.4°). The highest mean value was in the 10–19-year group (52.1°), and the lowest in the ≥80-year group (39.6°). Minimum values decreased to 0° in individuals aged ≥60 years. No significant differences were found across age groups (p=0.561). A weak but significant negative correlation was observed between age and lumbar lordosis (r=–0.247, p<0.0001).
Conclusions
AI-based automated measurement enabled efficient large-scale analysis and revealed a wide distribution of lumbar lordosis with a gradual age-related decline. These findings highlight the value of AI in spinal alignment assessment.
대규모 기립 측면 척추 X-ray 데이터에 AI 기반 자동 측정 모델을 적용하여 요추 전만각과 연령 간의 연관성을 평가하고자 하였다.
대상 및 방법
본 후향적 연구는 2019-2021년 동안 수집된 2,397장의 척추 X-ray 영상 중 고품질 영상 904장을 분석하였다. 요추 전만각은 제1요추 상부 종판과 제1천추 상부 종판 사이의 각도로 정의하였으며, 선행 연구에서 검증된 딥러닝 모델을 이용해 자동 측정하였다. 대상자는 9개 연령대로 분류하였다. 연령대 간 차이는 일원분산분석(ANOVA)으로, 연령과 요추 전만각의 상관성은 Pearson 상관분석으로 평가하였다.
결과
요추 전만각은 0°에서 84°의 범위를 보였으며 평균은 45.9°±13.4°였다. 평균값은 10-19세군에서 가장 높았고(52.1°), 80세 이상군에서 가장 낮았다(39.6°). 최소값은 60세 이상군에서 0°까지 감소하였다. 연령대 간 유의한 차이는 없었다(p=0.561). 전체 대상자에서 연령과 요추 전만각 사이에는 유의하나 약한 음의 상관관계가 확인되었다(r=-0.247, p<0.0001).
결론
AI 기반 자동 측정은 대규모 영상을 효율적으로 분석할 수 있게 해주었으며, 요추 전만각은 넓은 분포를 보였고 연령 증가에 따라 점진적으로 감소하는 경향을 나타냈다. 이러한 결과는 척추 정렬 평가에 있어 AI의 유용성을 보여준다.
Lumbar lordosis is a fundamental component of sagittal spinal alignment and plays a crucial role in maintaining an upright posture, distributing mechanical loads, and enabling efficient bipedal locomotion.1) Proper lumbar curvature contributes to spinal stability and balanced alignment of the pelvis and thoracic spine. Abnormalities in lumbar lordosis, including both hyperlordosis and hypolordosis, have been associated with spinal imbalance, degenerative changes, and altered biomechanics that may lead to pain or functional impairment.2) Normative values for lumbar lordosis have therefore been considered essential for the assessment of spinal deformity, postoperative alignment goals, and the evaluation of age-related or disease-related spinal changes.3)
Recent advances in artificial intelligence have enabled rapid and automated analysis of large-scale medical imaging datasets. In the field of radiology, deep learning systems have been used to detect abnormalities, segment anatomical structures, and provide quantitative measurements with improved consistency.4) AI applications in spine imaging have expanded to include automated spinal alignment assessment, vertebral landmark detection, and evaluation of degenerative pathology.5) Such technologies allow clinicians and researchers to process extensive imaging datasets quickly and objectively, facilitating large cohort studies and reducing variability associated with manual measurements.6)
Despite the clinical importance of lumbar lordosis and the growing utility of AI in radiographic analysis, large-scale investigations using AI-based X-ray evaluation to explore the relationship between lumbar lordosis and age remain limited. Previous studies have often included relatively small sample sizes or relied on manual measurements that are time-consuming and susceptible to interobserver variation.7) The present study aims to examine the associations between lumbar lordosis and age by employing AI-driven analysis of a large dataset of lumbar spine radiographs.
Materials and Methods
1. Study Design and Participants
This retrospective observational study was conducted with the approval of the Institutional Review Board (IRB) of the Catholic Kwandong University International St. Mary’s Hospital (IRB No. IS20RISI0015). The study was based on a total of 2,397 standing whole-spine lateral radiographs collected from the institution’s Picture Archiving and Communication System (PACS) between 2019 and 2021. Among these, only high-quality images with clearly identifiable anatomical structures and minimal image noise were selected, and 904 radiographs that met these criteria were ultimately included in the analysis. Demographic information, including age and sex, was obtained for each subject, and all imaging data were fully de-identified prior to use in the study. Lumbar lordosis angles were extracted from each radiograph using an AI-based automated measurement system.
2. AI-Based Automated Measurement System
In this study, lumbar lordosis was automatically calculated using a previously developed and validated deep learning–based measurement model.8) Lumbar lordosis was defined and measured as the angle between the superior endplate of L1 and the superior endplate of S1, which is the most commonly used method.9) The deep-learning– based automatic measurement system was developed using the Detectron2 framework with a Keypoint RCNN and a ResNeXt-101 backbone pretrained on ImageNet. The model was trained for 30,000 iterations using stochastic gradient descent and the standard Detectron2 optimization schedule. Input images were uniformly resized to 1024 pixels, and data augmentation such as random rotation and adjustments in brightness and saturation was applied to improve generalizability. All training and inference procedures were performed on a high-performance workstation equipped with dual RTX 4090 GPUs. Details regarding the algorithm architecture and validation procedures have been described in the earlier publication8. In the present study, the model was used solely as an automated measurement tool without additional training.
3. Statistical Analysis
For statistical analysis, the subjects were categorized into nine age groups: 0–9, 10–19, 20–29, 30–39, 40–49, 50–59, 60–69, 70–79, and ≥80 years. To compare differences in mean lumbar lordosis across age groups, a one-way analysis of variance (one-way ANOVA) was performed. Additionally, Pearson correlation analysis was conducted to evaluate the correlation between age and lumbar lordosis. All analyses were performed using Python (version 3.9; Python Software Foundation, Wilmington, DE, USA) and R (version 4.5.2; R Foundation for Statistical Computing, Vienna, Austria) in RStudio (version 2025.09.2; RStudio Team, Boston, MA, USA). A p-value < 0.05 was considered statistically significant.
Results
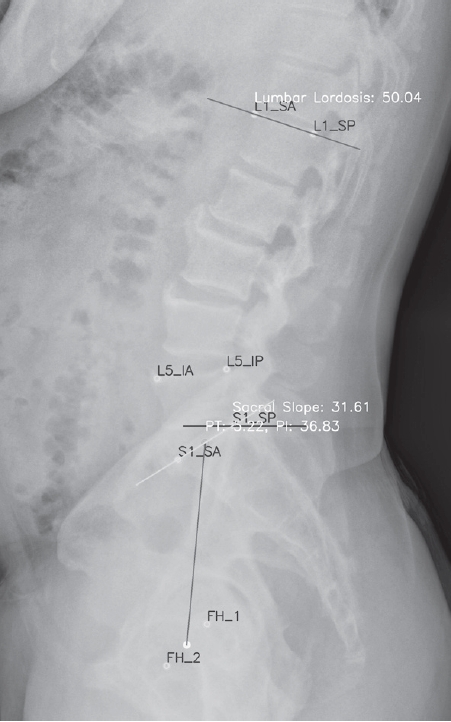
A total of 904 patients were included in the analysis. A representative image of lumbar lordosis measured by the AI-based automated model is shown in Fig. 1. The age distribution of the study population is presented in Table 1. The 60–69-year group comprised the largest proportion, with 203 patients (22.5%), followed by the 10–19-year group with 169 patients (18.7%). In contrast, the 20–29-year group had the smallest representation, with 26 patients (2.9%). Overall, a substantial number of patients were concentrated in the older adult (60–79 years). Females (548 patients, 60.6%) outnumbered males (356 patients, 39.4%).
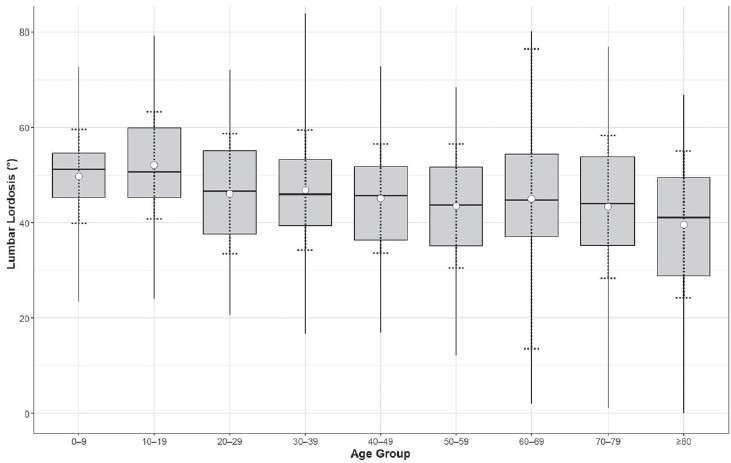
The distribution of lumbar lordosis across age groups, based on descriptive statistics, is shown in Table 2. Lumbar lordosis (LL) showed the highest mean value in the 10–19-year group (52.1°), whereas the ≥80-year group demonstrated the lowest mean value (39.6°). A marked decrease in the minimum values to approximately 0° was observed in the older adult group aged 60 years or older. Overall, the mean lumbar lordosis was 45.9°±13.4°, with a wide range from 0° to 83.7°. Fig. 2 illustrates the distribution of lumbar lordosis across age groups, depicted using box plots and mean error bar plots.
The one-way ANOVA performed for lumbar lordosis across age groups yielded an F-statistic of 0.811 and a pvalue of 0.561, indicating that no statistically significant differences were observed among the 10-year age groups.
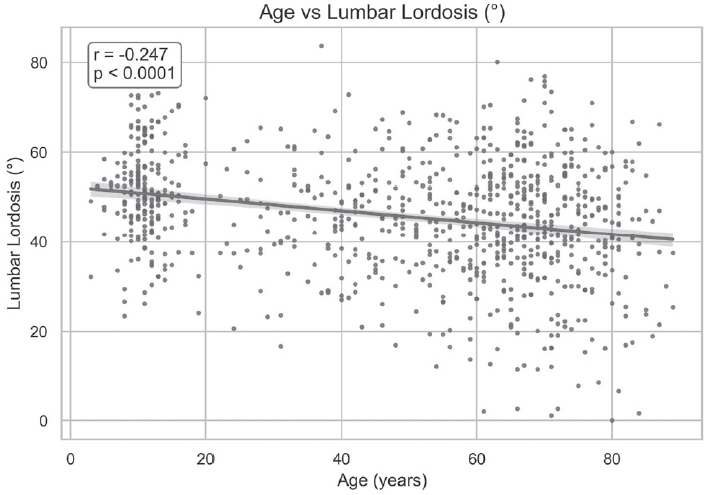
In the overall study population, Pearson correlation analysis between age and lumbar lordosis showed a significant but weak negative association, with r=–0.247 and p<0.0001, suggesting a tendency for lumbar lordosis to decrease with increasing age (Fig. 3).
Discussion
In this study, we utilized an AI-based measurement model to analyze a large-scale clinical imaging dataset. Lumbar lordosis exhibited a wide distribution, and correlation analysis revealed a weak negative association with age, indicating that lumbar lordosis tends to decrease as age increases.
Lumbar lordosis is the natural inward curvature of the lower spine that contributes to sagittal balance and load distribution across the vertebral column. However, substantial variability in its “normal” range has been reported in the literature due to differences in measurement techniques, populations, and individual characteristics. An early radiographic study defined a normal lumbar lordotic angle between approximately 20° and 45° based on one standard deviation from the mean in asymptomatic adults, suggesting that values within this range may represent physiological alignment in the general population.10) Another radiographic study has reported a considerably wider range, such as 31° to 88° in asymptomatic volunteers, emphasizing that normal lumbar lordosis is strongly influenced by demographic factors and individual morphology.11) In this study, lumbar lordosis ranged from 0° to 84°, with a mean value of 46°. The study population included individuals across the full age spectrum from children to older adults and also contained a subset of patients with spinal disorders. These characteristics likely contributed to the broader range of lumbar lordosis values observed compared with those reported in previous studies.
Previous research on the relationship between lumbar lordosis and age has produced mixed findings, reflecting the complexity of age-associated changes in spinal alignment. A radiographic analysis found that lumbar lordosis decreased linearly with age, with reductions observed in vertebral body and intervertebral disc wedging among older adults, indicating an age-related loss of lordotic curvature across the adult lifespan.12) However, a large cross-sectional investigation using standing sagittal radiographs of asymptomatic adults over 50 years old did not find a significant decrease in lumbar lordosis with age, although pelvic and thoracic alignment parameters did change, suggesting that age-related sagittal balance alterations are multifactorial and not limited to the lumbar region.13) In this study, we identified a weak but statistically significant negative correlation between lumbar lordosis and age. In addition, a marked decrease in the minimum values to 0° was observed in the older adult group aged 60 years or older, which may be attributable to degenerative changes of the spine or osteoporotic vertebral compression fractures.
The distinguishing feature of this study is the use of an AI model to analyze a large-scale dataset of over 900 spinal Xrays. In this study, the AI model measured lumbar lordosis in 904 X-rays within just a few seconds. In contrast, having orthopedic or radiologists manually measure parameters from such a large number of X-rays would be extremely time-consuming and practically unfeasible. By replacing tasks that previously required manual measurement with AI, as demonstrated in this study, the scope of research can be significantly expanded, and efficiency dramatically improved. Furthermore, the development of new AI models could be integrated into clinical practice, potentially enhancing the quality of patient care.
This study has several limitations. First, the angles measured by the AI were not independently verified by orthopedic surgeons or radiologists. Although the AI model used in this study demonstrated high reliability, it is not entirely free from errors. Therefore, future studies should include validation steps to address this limitation. Second, there was no control over the patient population included in the study. As the study was based on patients who visited the hospital and underwent whole spine X-rays, the sample may not be fully representative of the general population, and selection bias may have been introduced. Nevertheless, the random inclusion of patients partially mitigates this limitation, and further studies with more controlled populations are warranted.
In conclusion, this study utilized an AI-based measurement model to analyze lumbar lordosis, revealing a wide distribution and a weak negative correlation with age, indicating that lumbar lordosis tends to decrease as age increases. The distribution of lumbar lordosis across all age groups and its age-related correlation identified in this study can provide valuable insights not only for spinal surgeons but also for general patients to better understand normal spinal alignment and its natural progression. Moreover, by employing AI to analyze a large-scale dataset of spinal X-rays, this study lays the groundwork for further AI-based spinal alignment research, which is expected to become increasingly active in the future.
NOTES
Acknowledgements
This work was supported by the National Research Foundation of Korea (NRF) grant funded by the Korea government (MSIT) (RS-2023-00239313). Also, this research was supported by a grant from the Korea Health Technology R&D Project through the Korea Health Industry Development Institute (KHIDI), funded by the Ministry of Health & Welfare, Republic of Korea (RS-2023-KH142586).
Fig. 1.
A representative image measured by the AI-based automated measurement model. In addition to lumbar lordosis, spinopelvic parameters such as sacral slope, pelvic tilt, and pelvic incidence can also be measured.
Fig. 2.
Lumbar lordosis by age group. Boxplots represent the distribution of lumbar lordosis for each age group, indicating the minimum, first quartile (Q1), median, third quartile (Q3), and maximum values. Mean values and standard deviation are shown as open circles and dashed lines around the mean.
Fig. 3.
A scatter plot displaying lumbar lordosis across the full age range was generated, with a linear regression line overlaid based on Pearson correlation analysis. A statistically significant but weak negative correlation was observed between lumbar lordosis and age (Pearson’s r=–0.247, p<0.0001).
Table 1.
Number of patients by age group in the dataset
Age group
Overall (n=904)
Female (n=548)
Male (n=356)
0–9
56 (6.2%)
41
15
10–19
169 (18.7%)
94
75
20–29
26 (2.9%)
10
16
30–39
49 (5.4%)
20
29
40–49
84 (9.3%)
39
45
50–59
103 (11.4%)
65
38
60–69
203 (22.5%)
130
73
70–79
160 (17.7%)
112
48
≥80
54 (6.0%)
37
17
Table 2.
Descriptive statistics of lumbar lordosis across age groups
Age group
Mean (°)
SD (°)
Min (°)
Q1 (°)
Median (°)
Q3 (°)
Max (°)
0–9
49.7
9.9
23.4
45.2
51.2
54.6
72.7
10–19
52.1
11.2
24.1
45.3
50.7
60.0
79.2
20–29
46.1
12.6
20.7
37.7
46.7
55.1
72.1
30–39
46.8
12.6
16.7
39.5
45.9
53.3
83.7
40–49
45.1
11.4
16.9
36.4
45.7
51.8
72.9
50–59
43.5
13.0
12.2
35.1
43.7
51.6
68.4
60–69
45.0
31.4
2.1
37.0
44.8
54.3
80.2
70–79
43.3
15.0
1.1
35.2
44.0
53.8
77.0
≥80
39.6
15.4
0.0
28.9
41.1
49.6
66.8
Overall
45.9
13.4
0.0
37.9
46.5
54.5
83.7
SD: standard deviation, Min: minimum, Q1: first quartile, Q3: third quartile, Max: maximum.
References
1. Vaz G, Roussouly P, Berthonnaud E, Dimnet J. Sagittal morphology and equilibrium of pelvis and spine. Eur Spine J Feb;2002 11(1):80-7. doi:10.1007/s005860000224.
2. Cho KJ, Suk SI, Park SR, et al. Risk factors of sagittal decompensation after long posterior instrumentation and fusion for degenerative lumbar scoliosis. Spine (Phila Pa 1976) Aug 1 2010 35(17):1595-601. doi:10.1097/BRS.0b013e3181bdad89.
3. Lee CS, Chung SS, Kang KC, Park SJ, Shin SK. Normal patterns of sagittal alignment of the spine in young adults radiological analysis in a Korean population. Spine (Phila Pa 1976) Dec 1 2011 36(25):E1648-54. doi:10.1097/BRS.0b013e318216b0fd.
4. Chartrand G, Cheng PM, Vorontsov E, et al. Deep Learning: A Primer for Radiologists. Radiographics Nov-Dec;2017 37(7):2113-31. doi:10.1148/rg.2017170077.
6. Pan L, Zhao Z, Lu Y. Opportunities and challenges in the application of large artificial intelligence models in radiology. Meta-Radiology 2024/06/01/2024;2(2):100080. doi:https://doi.org/10.1016/j.metrad.2024.100080.
7. Vrtovec T, Pernus F, Likar B. A review of methods for quantitative evaluation of spinal curvature. Eur Spine J May;2009 18(5):593-607. doi:10.1007/s00586-009-0913-0.
8. Lee S-B, Chae D-S, Oh SH, Kang K-Y, Lee M-K. Measurement of Lumbar Lordosis Using a Deep Learning-Based Artificial Intelligence Model. J Adv Spine Surg 6;2025 15(1):1-7. doi:10.63858/jass.15.1.1.
11. Jackson RP, McManus AC. Radiographic Analysis of Sagittal Plane Alignment and Balance in Standing Volunteers and Patients with Low Back Pain Matched for Age, Sex, and Size: A Prospective Controlled Clinical Study. Spine 1994;19(14.
12. Baumann CA, Pazooki P, McNamara KP, et al. Characterization of Lumbar Lordosis: Influence of Age, Sex, Vertebral Body Wedging, and L4-S1. Clinical Spine Surgery 2025;38(1):E30-E7. doi:10.1097/bsd.0000000000001640.
13. Wang W, Wang Z, Wang D, et al. Age-Related Changes and Spinal Sagittal Alignment in Asymptomatic Community-Dwelling Adults Over 50. Spine 2025;50(21):E431-E7. doi:10.1097/brs.0000000000005248.
Deep Learning–based AI Analysis of the Correlation Between Lumbar Lordosis and Age
Fig. 1. A representative image measured by the AI-based automated measurement model. In addition to lumbar lordosis, spinopelvic parameters such as sacral slope, pelvic tilt, and pelvic incidence can also be measured.
Fig. 2. Lumbar lordosis by age group. Boxplots represent the distribution of lumbar lordosis for each age group, indicating the minimum, first quartile (Q1), median, third quartile (Q3), and maximum values. Mean values and standard deviation are shown as open circles and dashed lines around the mean.
Fig. 3. A scatter plot displaying lumbar lordosis across the full age range was generated, with a linear regression line overlaid based on Pearson correlation analysis. A statistically significant but weak negative correlation was observed between lumbar lordosis and age (Pearson’s r=–0.247, p<0.0001).
Fig. 1.
Fig. 2.
Fig. 3.
Deep Learning–based AI Analysis of the Correlation Between Lumbar Lordosis and Age
Age group
Overall (n=904)
Female (n=548)
Male (n=356)
0–9
56 (6.2%)
41
15
10–19
169 (18.7%)
94
75
20–29
26 (2.9%)
10
16
30–39
49 (5.4%)
20
29
40–49
84 (9.3%)
39
45
50–59
103 (11.4%)
65
38
60–69
203 (22.5%)
130
73
70–79
160 (17.7%)
112
48
≥80
54 (6.0%)
37
17
Age group
Mean (°)
SD (°)
Min (°)
Q1 (°)
Median (°)
Q3 (°)
Max (°)
0–9
49.7
9.9
23.4
45.2
51.2
54.6
72.7
10–19
52.1
11.2
24.1
45.3
50.7
60.0
79.2
20–29
46.1
12.6
20.7
37.7
46.7
55.1
72.1
30–39
46.8
12.6
16.7
39.5
45.9
53.3
83.7
40–49
45.1
11.4
16.9
36.4
45.7
51.8
72.9
50–59
43.5
13.0
12.2
35.1
43.7
51.6
68.4
60–69
45.0
31.4
2.1
37.0
44.8
54.3
80.2
70–79
43.3
15.0
1.1
35.2
44.0
53.8
77.0
≥80
39.6
15.4
0.0
28.9
41.1
49.6
66.8
Overall
45.9
13.4
0.0
37.9
46.5
54.5
83.7
Table 1. Number of patients by age group in the dataset
Table 2. Descriptive statistics of lumbar lordosis across age groups
SD: standard deviation, Min: minimum, Q1: first quartile, Q3: third quartile, Max: maximum.